☰Read-only archive⌕
Looking for help with Bokeh?

This is a read-only archive. Ask questions and join the conversation on GitHub.

Visit Community Support on GitHub →
Archived discussions · Captured October 28, 2026

Covid analytical dashboard + Bokeh feedback

Showcase
ghomem
ghomem

Hi,

I’ve put together a Bokeh app that provides a detailed visualization for Covid19 data for Portugal in a way that I find be more useful than what is available in the official dashboards. The code is open source and can be reused for similar projects.

It is here:

https://coviz.io/

and here

Major difficulties I had while using Bokeh:

  • understanding how to make tooltips that include the info for all the series and understanding what is the best way to attach them to a specific line
  • dealing with the relationship between a date range slider and the rescaling of the y axis on multiline plots
  • working with dates in general, which was not 100% obvious :slight_smile:

Still, doing visualizations in python is worth any challenge :smiley:

Thanks for Bokeh.

Regards,
Gustavo
⌁   Link to post
odadoun
odadoun

Hi @ghomem,

thanks for sharing this very nice dashboard.
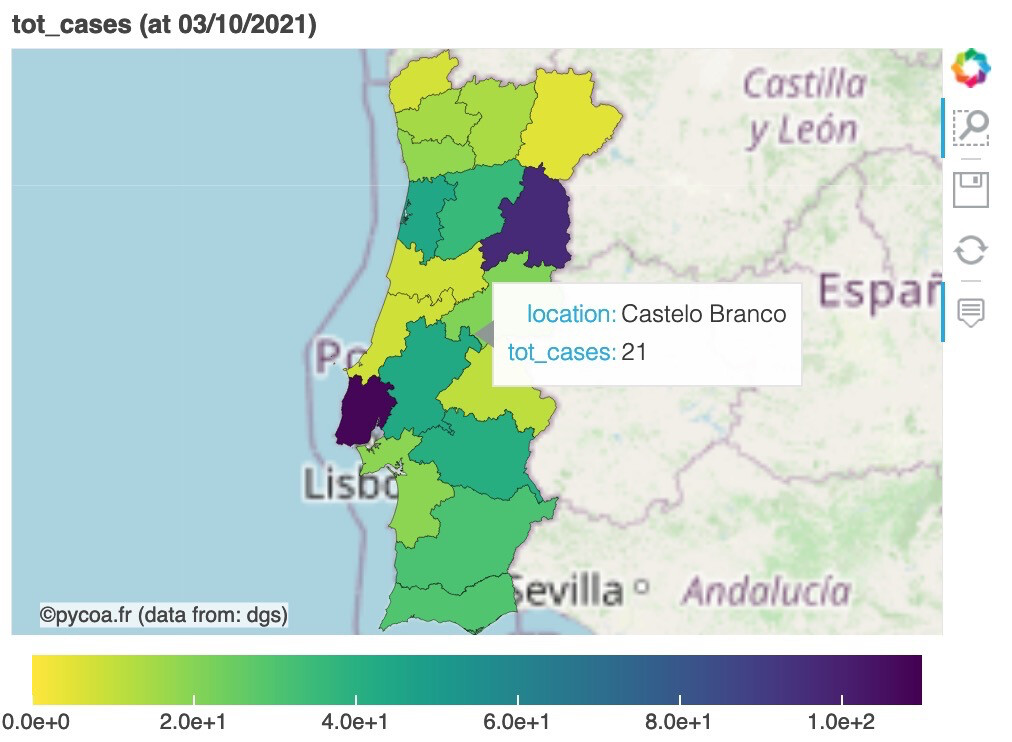
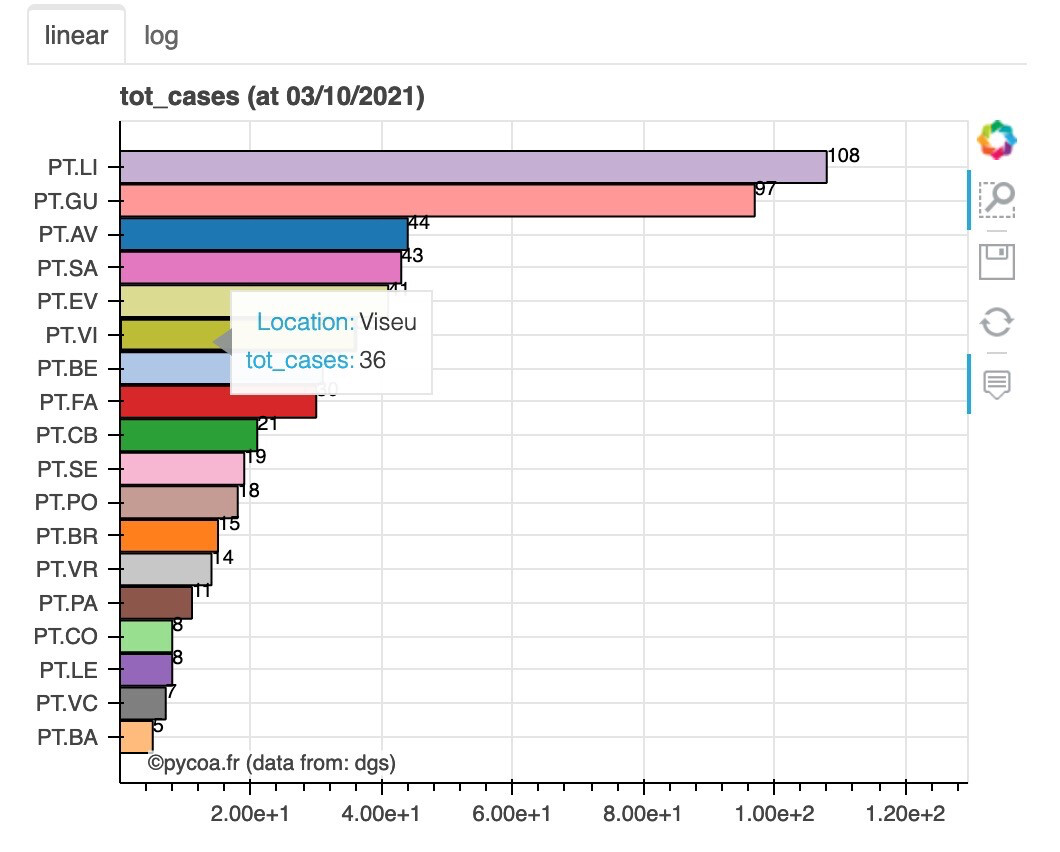
I would like to point to you our Python Covid Analysis toolkit (aka pycoa, www.pycoa.fr 100% Open/Free source).
We have added recently Portugal Covid Cases using Direcção Geral de Saúde - Ministério da Saúde Português data.
So far only Covid Cases is available.
You have the possibility to draw map, histo/pie and dateplot chart.
Please do not hesitate to have a look into our code (GitHub - coa-project/pycoa: pycoa Python source code the dev version). There is a demo Nootebook without installation using (the amazing) binder techno
(GitHub - coa-project/coadocker: Dokerfile and click to ‘launch binder’)
Here an example of a map and a histogram.
Hope you will like it.
cheers
Olivier


PS: so far 9 national Covid data are available : PRT, SPA, FRA, ITA, BEL, UK ,DEU, IND, USA (and 2 world DB)

⌁   Link to post
ghomem
ghomem

Hi @odadoun ,

Thank you for sharing this.

One question: how are you obtaining the Portuguese data?

I am using the repos from the Data Science for Social Good Portugal:

Cheers,
Gustavo

⌁   Link to post

End of archived discussion · Replies are disabled