Hi all, I am trying to create a single page of multiple, independent plots and I need to create some gap between them to improve readability.
I tried using min_border_bottom etc.on individual plots but I didn’t see any difference between the plots. I also tried specifying width, height of 500 for individual plots and keeping them as 600 for the grid plot (where i am combining them together as below), but all the plots are uniformly spread again without much gap.
show(gridplot([[p1, p2],[p3, p4, p5]],
              plot_width = 600, plot_height = 600
              ))
Here is the screenshot
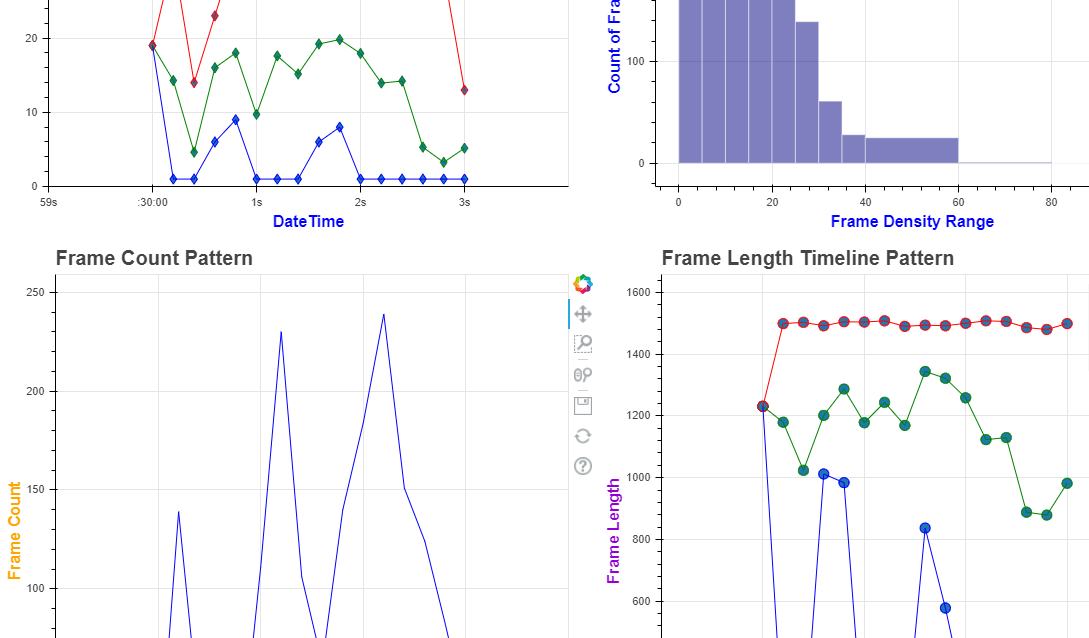
I would like to create more spacing between the top and bottom plots as well as between the left and right ones as well. I can try crating some filler elements like paragraph with no content, but I am pretty sure there must be some elegant way of doing this.
My search for similar posts only found where they were trying to remove the gaps but not to add the gaps.
Any tips on the above scenario would be highly appreciated!
Thanks.