Hi,
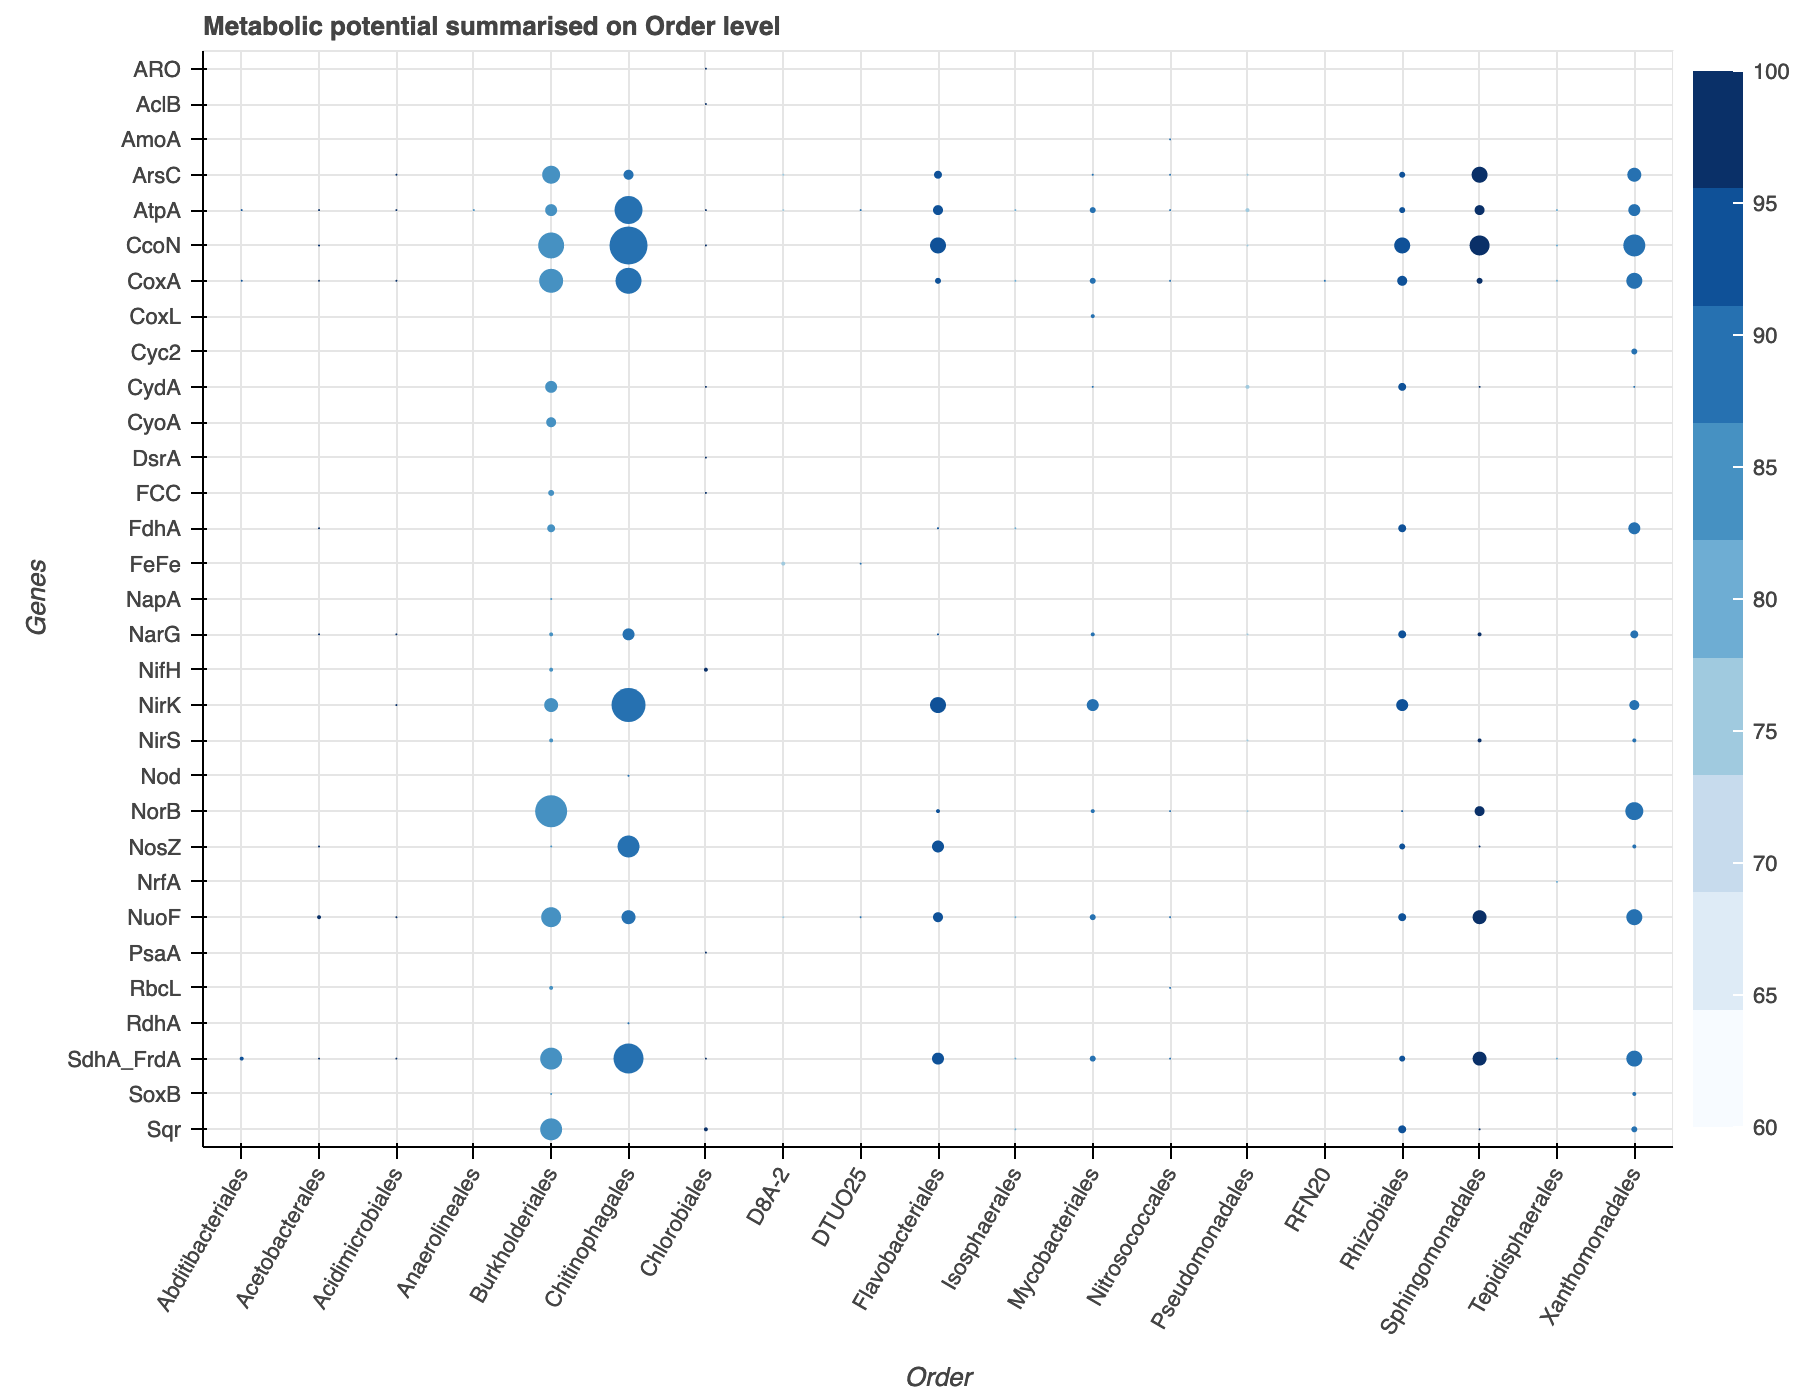
Great program, I’m asking for help in creating a plot similar to:
My codes:
import pandas as pd
import numpy as np
import math
from bokeh.palettes import Blues
from bokeh.models import LinearColorMapper, ColumnDataSource, ColorBar, Legend
from bokeh.models.ranges import FactorRange
from bokeh.plotting import figure, show
from bokeh.io import output_notebook

output_notebook()
df = c

colors = list(reversed(Blues[9]))

exp_cmap = LinearColorMapper(palette=colors,
                             low = 60,
                             high = 100)

p = figure(x_range = FactorRange(), y_range = FactorRange(), plot_width=900,
           plot_height=700, title="Metabolic potential summarised on Order level",
           toolbar_location=None, tools="hover")

p.scatter("order","gene",source=df, fill_alpha=1,  line_width=0, size="gene_count",
          fill_color={"field":"avg_comp", "transform":exp_cmap})

p.x_range.factors = sorted(df['order'].unique().tolist())
p.y_range.factors = sorted(df['gene'].unique().tolist(), reverse = True)

p.xaxis.axis_label = 'Order'
p.xaxis.major_label_orientation = math.pi/3
p.yaxis.axis_label = 'Genes'

bar = ColorBar(color_mapper=exp_cmap, location=(0,0))
p.add_layout(bar, "right")

show(p)
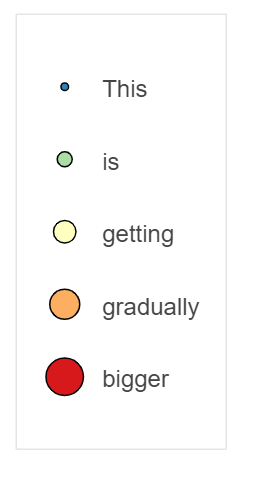
I want to add an legend to indicate the size of of the scatters in the plot, how can I do that?
Many thanks.