Creating straight line using drag and custom js

Hello everyone , Can anybody suggest me how I can draw straight line using mouse drag between two point . What I want is exactly same functionality as of FreeHandTool, but it should be a straight line, like we get by using Line glyphs. Is there any way to use customjs and drag event to get straight line.
Thank you .

Looking at the example A New Custom Tool in the Extending Bokeh User Guide chapter, the relevant bit of code is:

  //this is executed on subsequent mouse/touch moves
  _pan(ev: GestureEvent): void {
    const {frame} = this.plot_view

    const {sx, sy} = ev
    if (!frame.bbox.contains(sx, sy))
      return

    const x = frame.xscales.default.invert(sx)
    const y = frame.yscales.default.invert(sy)

    const {source} = this.model
    source.data.x.push(x)
    source.data.y.push(y)
    source.change.emit()
  }

You can see that it adds (pushes) every single new point to the x and y arrays. To make a tool that only draws a single line from initial point to current mouse location, you could change this code as follows:

  • if source.data.x is empty, push the x and y coords
  • if source.data.x has length 1, push the x and y coords
  • othwrwise, replace the last x and y coords, e.g
    source.data.x[1] = x
    source.data.y[1] = y
    

These changes should ensure that the arrays source.data.x and source.data.y only ever have at most two coordinates in them (i,e. a straight line).

Hello, as per your suggestion, i have created following code,

from bokeh.io import curdoc
from bokeh.plotting import figure, output_file, show
from bokeh.models import FreehandDrawTool, ColumnDataSource, Segment, CustomJS, Line, MultiLine

source = ColumnDataSource(data=dict(x=[], y=[]))

p = figure(x_range=(0, 10), y_range=(0, 10), width=400, height=400,
       title='Freehand Draw Tool')
r = p.multi_line('x', 'y', source=source)


draw_tool = FreehandDrawTool(renderers=[r], num_objects=2)

p.toolbar.active_drag = draw_tool
plot_line = ColumnDataSource(data=dict(x=[], y=[]))
callback = CustomJS(args=dict(source=plot_line), code="""

                 x0 = cb_obj.x;
                 y0 = cb_obj.y;

                 if(source.data.x.length == 0){
                       source.data.x.push(x0);
                       source.data.y.push(y0);
                 }else if(source.data.x.length == 1){
                       source.data.x.push(x0);
                       source.data.y.push(y0);
                }else {
                      source.data.x[1] = x0
                      source.data.y[1] = y0
                }


               //console.log(source.data.x, source.data.y)    

                source.change.emit()
            """)

rect = Line(x='x',
        y='y')
p.add_tools(draw_tool)
p.add_glyph(plot_line, rect, selection_glyph=rect, nonselection_glyph=rect)

p.js_on_event('tap', callback)
curdoc().add_root(p)

Above program creates a line on tap over plot. But here an issue is that how i can create multiple line, and how i can use mouse drag option.
Thank you.

Your original post does not mention needing to create multiple lines. Please be specific about what you are trying to achieve up front, it will help others help you. It’s not really clear what you want to be able to do as a result of having these lines drawn. Do you need the data? Only in JavaScript? Or in Python? Are these just annotations? What are they for? How does mouse drag enter in? It’s not necessary in order to draw lines, as the code above shows, so what do you imagine drag being used for? Please describe what you are trying to accomplish, from a user interaction perspective, in much greater detail.

I apologize for my mistake, I really appreciate your and others contribution to help me. I have to create multiple graphs and in those graphs, I have to provide multiple tools for user interaction, on similar lines like “Edit Tools”, so that user can create, for e.g., multiple lines (red line as in below graph). Hence, I was trying to know how can I create tools according to my needs by using custom JS or TS or python.
Here i have created a tool which create a Segment using A New Custom Tool as you mention in pervious post.

from bokeh.core.properties import Instance
from bokeh.io import output_file, show, curdoc
from bokeh.models import ColumnDataSource, Tool, Plot, Line, LinearAxis, Grid
from bokeh.plotting import figure
from bokeh.util.compiler import TypeScript
import numpy as np

TS_CODE = """
import {GestureTool, GestureToolView} from "models/tools/gestures/gesture_tool"
import {ColumnDataSource} from "models/sources/column_data_source"
import {GestureEvent} from "core/ui_events"
import * as p from "core/properties"


export class DrawToolView extends GestureToolView {
  model: DrawTool

  //this is executed when the pan/drag event starts
  _pan_start(_av: GestureEvent): void {
    this.model.source.data = {x: [], y: [], x1: [], y1: []}  

    }

 //this is executed on subsequent mouse/touch moves
 _pan(_ev: GestureEvent): void {
     const {frame} = this.plot_view
     const {sx, sy} = _ev
     if (!frame.bbox.contains(sx, sy))
       return
     const x = frame.xscales.default.invert(sx)
     const y = frame.yscales.default.invert(sy)
     const {source} = this.model
     source.get_array("x").push(x)
     source.get_array("y").push(y)
     //console.log("ON entry " + source.data.x[0], source.data.y[0])

   }


  // this is executed then the pan/drag ends
  _pan_end(_ev: GestureEvent): void {
      const {frame} = this.plot_view
      const {sx, sy} = _ev
      if (!frame.bbox.contains(sx, sy))
         return
      const x = frame.xscales.default.invert(sx)
      const y = frame.yscales.default.invert(sy)
      const {source} = this.model
      source.get_array("x1").push(x)
      source.get_array("y1").push(y)
      source.change.emit()
  }
}

 export namespace DrawTool {
   export type Attrs = p.AttrsOf<Props>

   export type Props = GestureTool.Props & {
       source: p.Property<ColumnDataSource>
  }
}

export interface DrawTool extends DrawTool.Attrs {}

export class DrawTool extends GestureTool {
   properties: DrawTool.Props

   constructor(attrs?: Partial<DrawTool.Attrs>) {
       super(attrs)
 }

  tool_name = "Drag Span"
  icon = "bk-tool-icon-lasso-select"
  event_type = "pan" as "pan"
  default_order = 3

  static initClass(): void {
    this.prototype.type = "DrawTool"
    this.prototype.default_view = DrawToolView

    this.define<DrawTool.Props>({
       source: [ p.Instance ],
    })
  }
}
DrawTool.initClass()
"""


class DrawTool(Tool):
    __implementation__ = TypeScript(TS_CODE)
    source = Instance(ColumnDataSource)


source = ColumnDataSource(data=dict(x=[], y=[], x1= [], y1= []))

plot = figure(tools=[DrawTool(source=source),])
plot.title.text = "Drag to draw on the plot"
plot.segment('x','y','x1','y1',source=source)


N = 30
x = np.linspace(-1, 1, N)
y = x**2

source1 = ColumnDataSource(dict(x=x, y=y))

glyph = Line(x="x", y="y", line_color="#f46d43", line_width=6, line_alpha=0.6)
plot.add_glyph(source1, glyph)
curdoc().add_root(plot)

What i want is basically provide users with various tools which help them to edit graphs as you can see that in above graph, users can create multiple lines for there understanding.

I hope after review all this things you might get some idea, what i am trying to accomplish.(Above image is just an example)

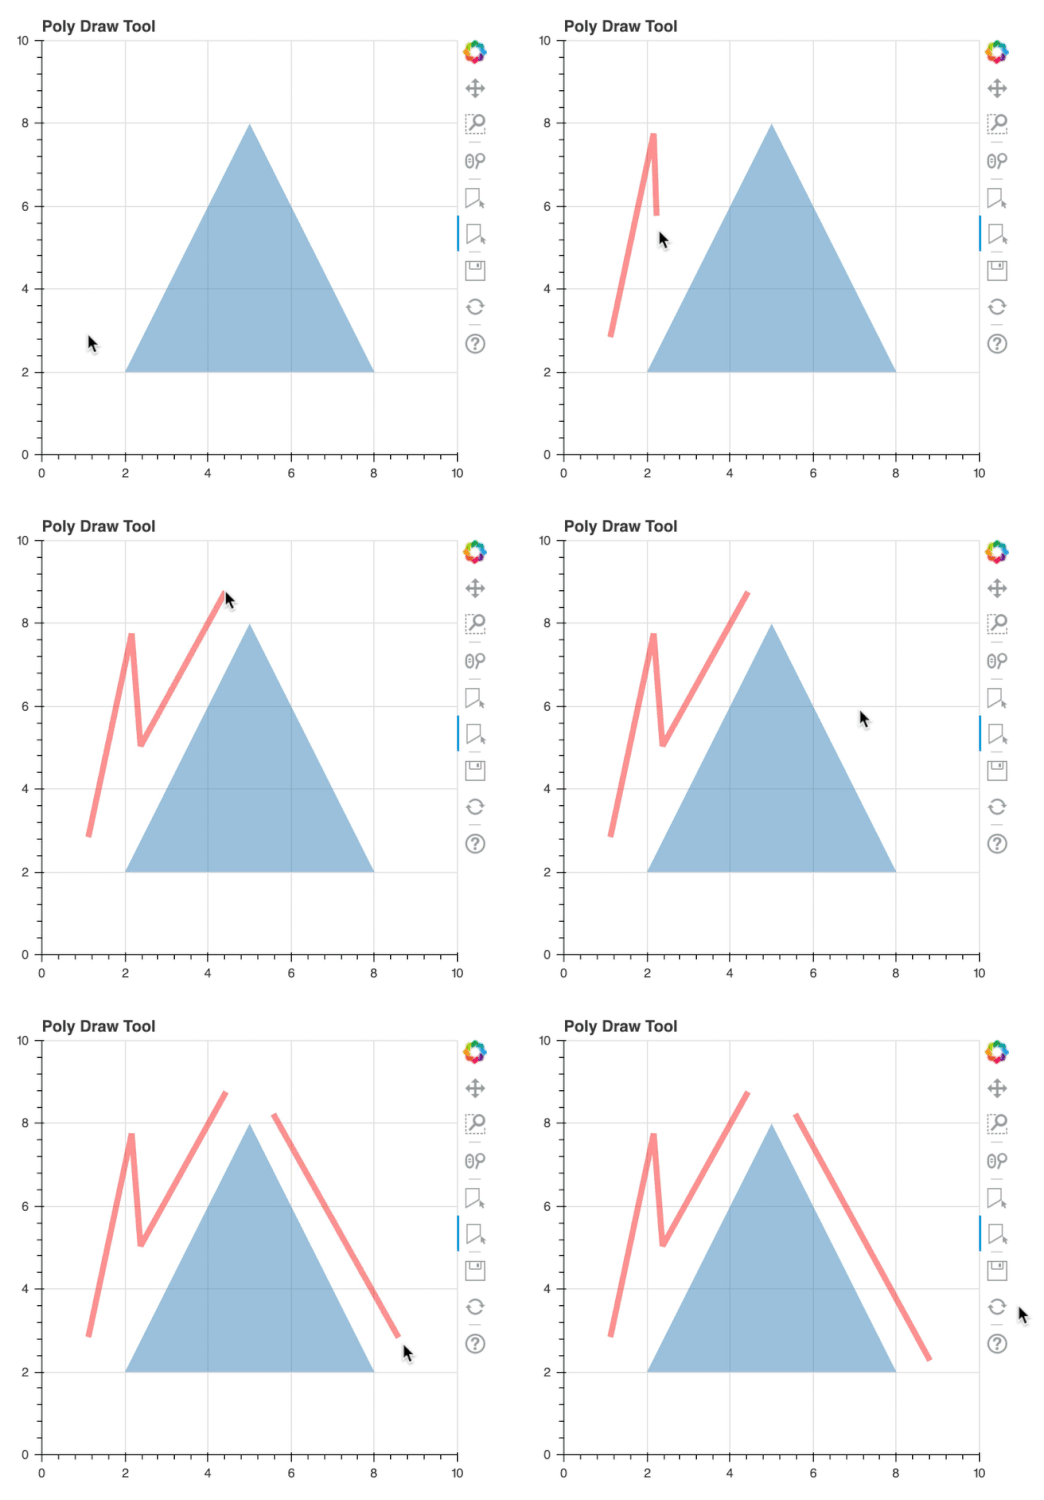
Before going further, I think you should take a closer look at the PolyDrawTool. Despite it’s name, it can be used to draw multiple polylines:

The coordinates of what gets drawn are conveniently, automatically stored in a ColumnDataSource for you to do whatever you want with.

I very strongly suggest you should consider finding a way to utilize this existing tool first. Simply because: any similar custom tool you create would be nearly as complicated as it is, and you can see by looking at the source code that is it is quite complicated (nearly 300 lines of TypeScript). If you must make a custom tool, then that is a bigger task than I can help with in detail, but all the source code for all the existing tools is available on GitHub to reference.
Thank you very much, Its work for me. :slight_smile:

1 Like