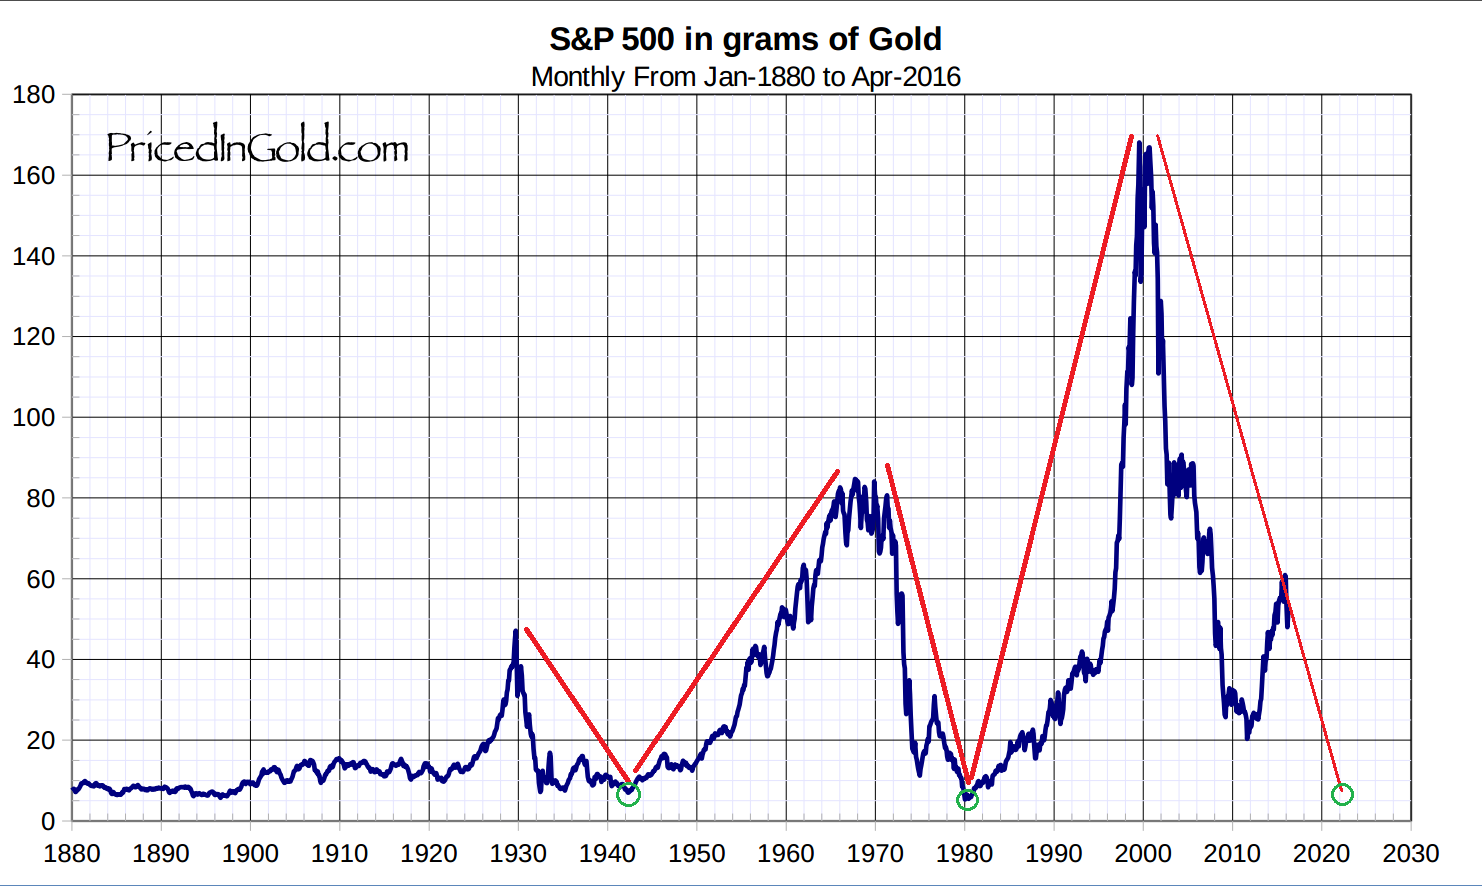
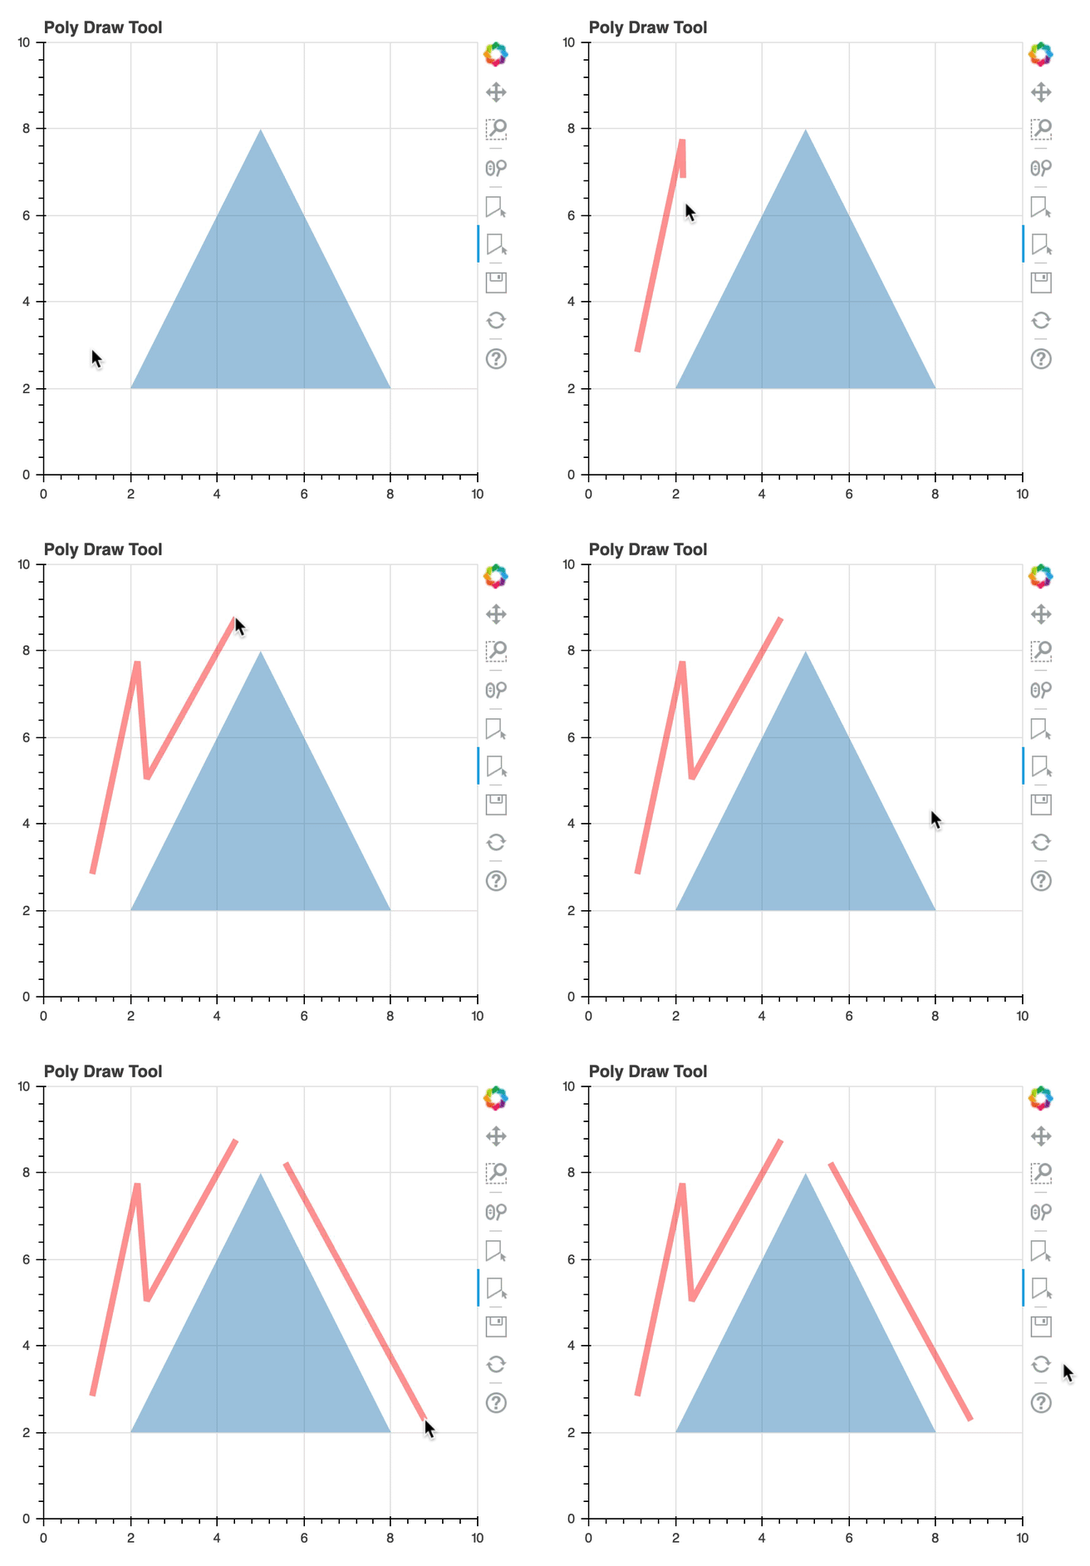
I apologize for my mistake, I really appreciate your and others contribution to help me. I have to create multiple graphs and in those graphs, I have to provide multiple tools for user interaction, on similar lines like “Edit Tools”, so that user can create, for e.g., multiple lines (red line as in below graph). Hence, I was trying to know how can I create tools according to my needs by using custom JS or TS or python.
Here i have created a tool which create a Segment using A New Custom Tool as you mention in pervious post.
from bokeh.core.properties import Instance
from bokeh.io import output_file, show, curdoc
from bokeh.models import ColumnDataSource, Tool, Plot, Line, LinearAxis, Grid
from bokeh.plotting import figure
from bokeh.util.compiler import TypeScript
import numpy as np

TS_CODE = """
import {GestureTool, GestureToolView} from "models/tools/gestures/gesture_tool"
import {ColumnDataSource} from "models/sources/column_data_source"
import {GestureEvent} from "core/ui_events"
import * as p from "core/properties"


export class DrawToolView extends GestureToolView {
  model: DrawTool

  //this is executed when the pan/drag event starts
  _pan_start(_av: GestureEvent): void {
    this.model.source.data = {x: [], y: [], x1: [], y1: []}

    }

 //this is executed on subsequent mouse/touch moves
 _pan(_ev: GestureEvent): void {
     const {frame} = this.plot_view
     const {sx, sy} = _ev
     if (!frame.bbox.contains(sx, sy))
       return
     const x = frame.xscales.default.invert(sx)
     const y = frame.yscales.default.invert(sy)
     const {source} = this.model
     source.get_array("x").push(x)
     source.get_array("y").push(y)
     //console.log("ON entry " + source.data.x[0], source.data.y[0])

   }


  // this is executed then the pan/drag ends
  _pan_end(_ev: GestureEvent): void {
      const {frame} = this.plot_view
      const {sx, sy} = _ev
      if (!frame.bbox.contains(sx, sy))
         return
      const x = frame.xscales.default.invert(sx)
      const y = frame.yscales.default.invert(sy)
      const {source} = this.model
      source.get_array("x1").push(x)
      source.get_array("y1").push(y)
      source.change.emit()
  }
}

 export namespace DrawTool {
   export type Attrs = p.AttrsOf<Props>

   export type Props = GestureTool.Props & {
       source: p.Property<ColumnDataSource>
  }
}

export interface DrawTool extends DrawTool.Attrs {}

export class DrawTool extends GestureTool {
   properties: DrawTool.Props

   constructor(attrs?: Partial<DrawTool.Attrs>) {
       super(attrs)
 }

  tool_name = "Drag Span"
  icon = "bk-tool-icon-lasso-select"
  event_type = "pan" as "pan"
  default_order = 3

  static initClass(): void {
    this.prototype.type = "DrawTool"
    this.prototype.default_view = DrawToolView

    this.define<DrawTool.Props>({
       source: [ p.Instance ],
    })
  }
}
DrawTool.initClass()
"""


class DrawTool(Tool):
    __implementation__ = TypeScript(TS_CODE)
    source = Instance(ColumnDataSource)


source = ColumnDataSource(data=dict(x=[], y=[], x1= [], y1= []))

plot = figure(tools=[DrawTool(source=source),])
plot.title.text = "Drag to draw on the plot"
plot.segment('x','y','x1','y1',source=source)


N = 30
x = np.linspace(-1, 1, N)
y = x**2

source1 = ColumnDataSource(dict(x=x, y=y))

glyph = Line(x="x", y="y", line_color="#f46d43", line_width=6, line_alpha=0.6)
plot.add_glyph(source1, glyph)
curdoc().add_root(plot)
What i want is basically provide users with various tools which help them to edit graphs as you can see that in above graph, users can create multiple lines for there understanding.
I hope after review all this things you might get some idea, what i am trying to accomplish.(Above image is just an example)