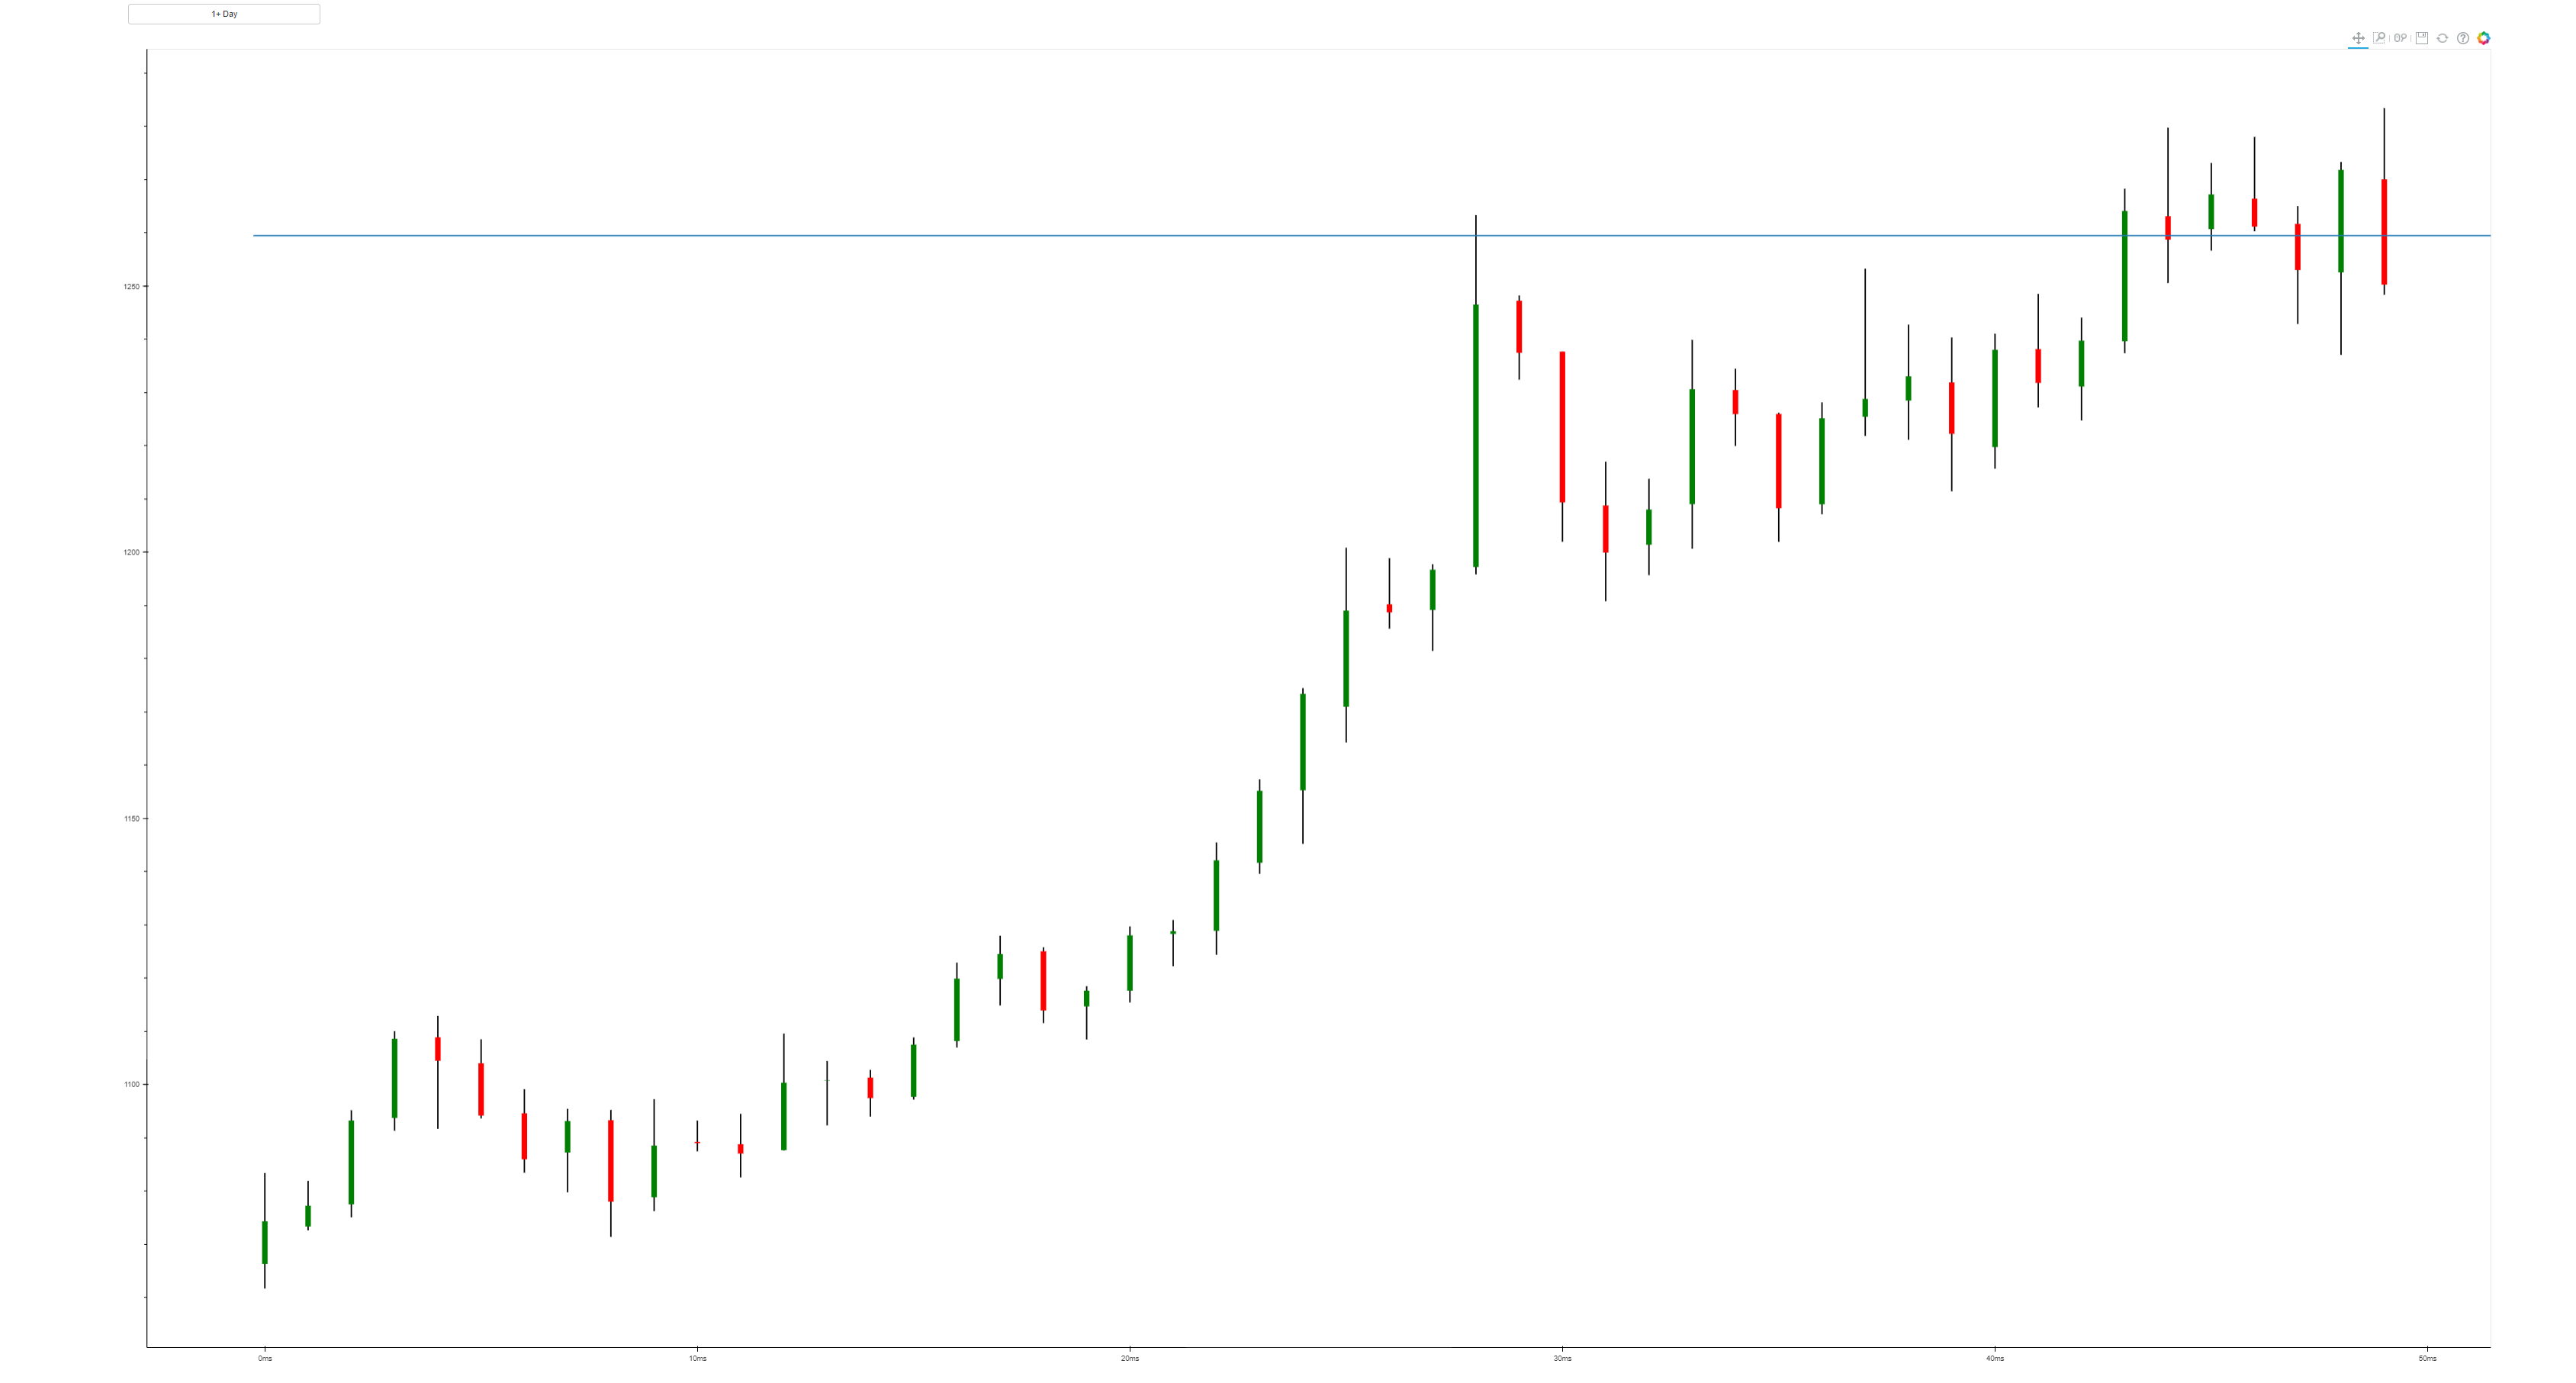
i have noticed that if i remove toolbar and x/y axis then this outcome doesn’t show up. Hence looks like the plot borders are kind of extended a bit outside the plot itself.
![]()
Virus-free. www.avast.com
···
On 29 November 2017 at 16:55, Andrea Tagliabue [email protected] wrote:
Sure
@classmethod
def Running(self):
session = push_session(curdoc())
screen_width,screen_height = ctypes.windll.user32.GetSystemMetrics(0)*0.85, ctypes.windll.user32.GetSystemMetrics(1)*0.85
df = self.Ohlc[:50]
source_ohlc = ColumnDataSource( { ‘time’: df.time, ‘low’ : df.low, ‘high’ : df.high, ‘open’ : df.open, ‘close’ : df.close, ‘color’ : df.color } )
self.p = figure( x_axis_type = ‘datetime’,plot_width=int(screen_width), plot_height=int(screen_height), toolbar_location = ‘above’ )
self.p.grid.grid_line_color = None
self.p.segment(x0=‘time’, y0=‘low’, x1=‘time’, y1=‘high’, line_width=2, color=‘black’, source = source_ohlc)
self.p.segment(x0=‘time’, y0=‘open’, x1=‘time’, y1=‘close’, line_width=8, color=‘color’, source = source_ohlc)
s1 = ColumnDataSource(data=dict(x=, y=, angle = ))
self.p.ray(x=‘x’, y=‘y’, angle = ‘angle’, length=0, line_dash=“solid”, line_width=2, source=s1)
self.p.js_on_event(Tap, CustomJS(args=dict(s=s1), code = “”"
s.data.x.push(cb_obj.x);
s.data.y.push(cb_obj.y);
s.data.angle.push(0);
s.trigger(‘change’)
“”"))
def update():
source_ohlc.data = dict(self.Ohlc[ : len(source_ohlc.data[‘close’]) +1 ])
button_2 = Button( label = ‘1+ Day’ )
button_2.on_click( update )
l = layout( column( button_2, self.p) )
session.show(l)
session.loop_until_closed()
Virus-free. www.avast.com

On 29 November 2017 at 16:52, Eugene Pakhomov [email protected] wrote:
Can you provide the code that you’ve come up with that results in this behavior?
- Eugene
On Wednesday, November 29, 2017 at 10:37:05 PM UTC+7, Andrea Tagliabue wrote:
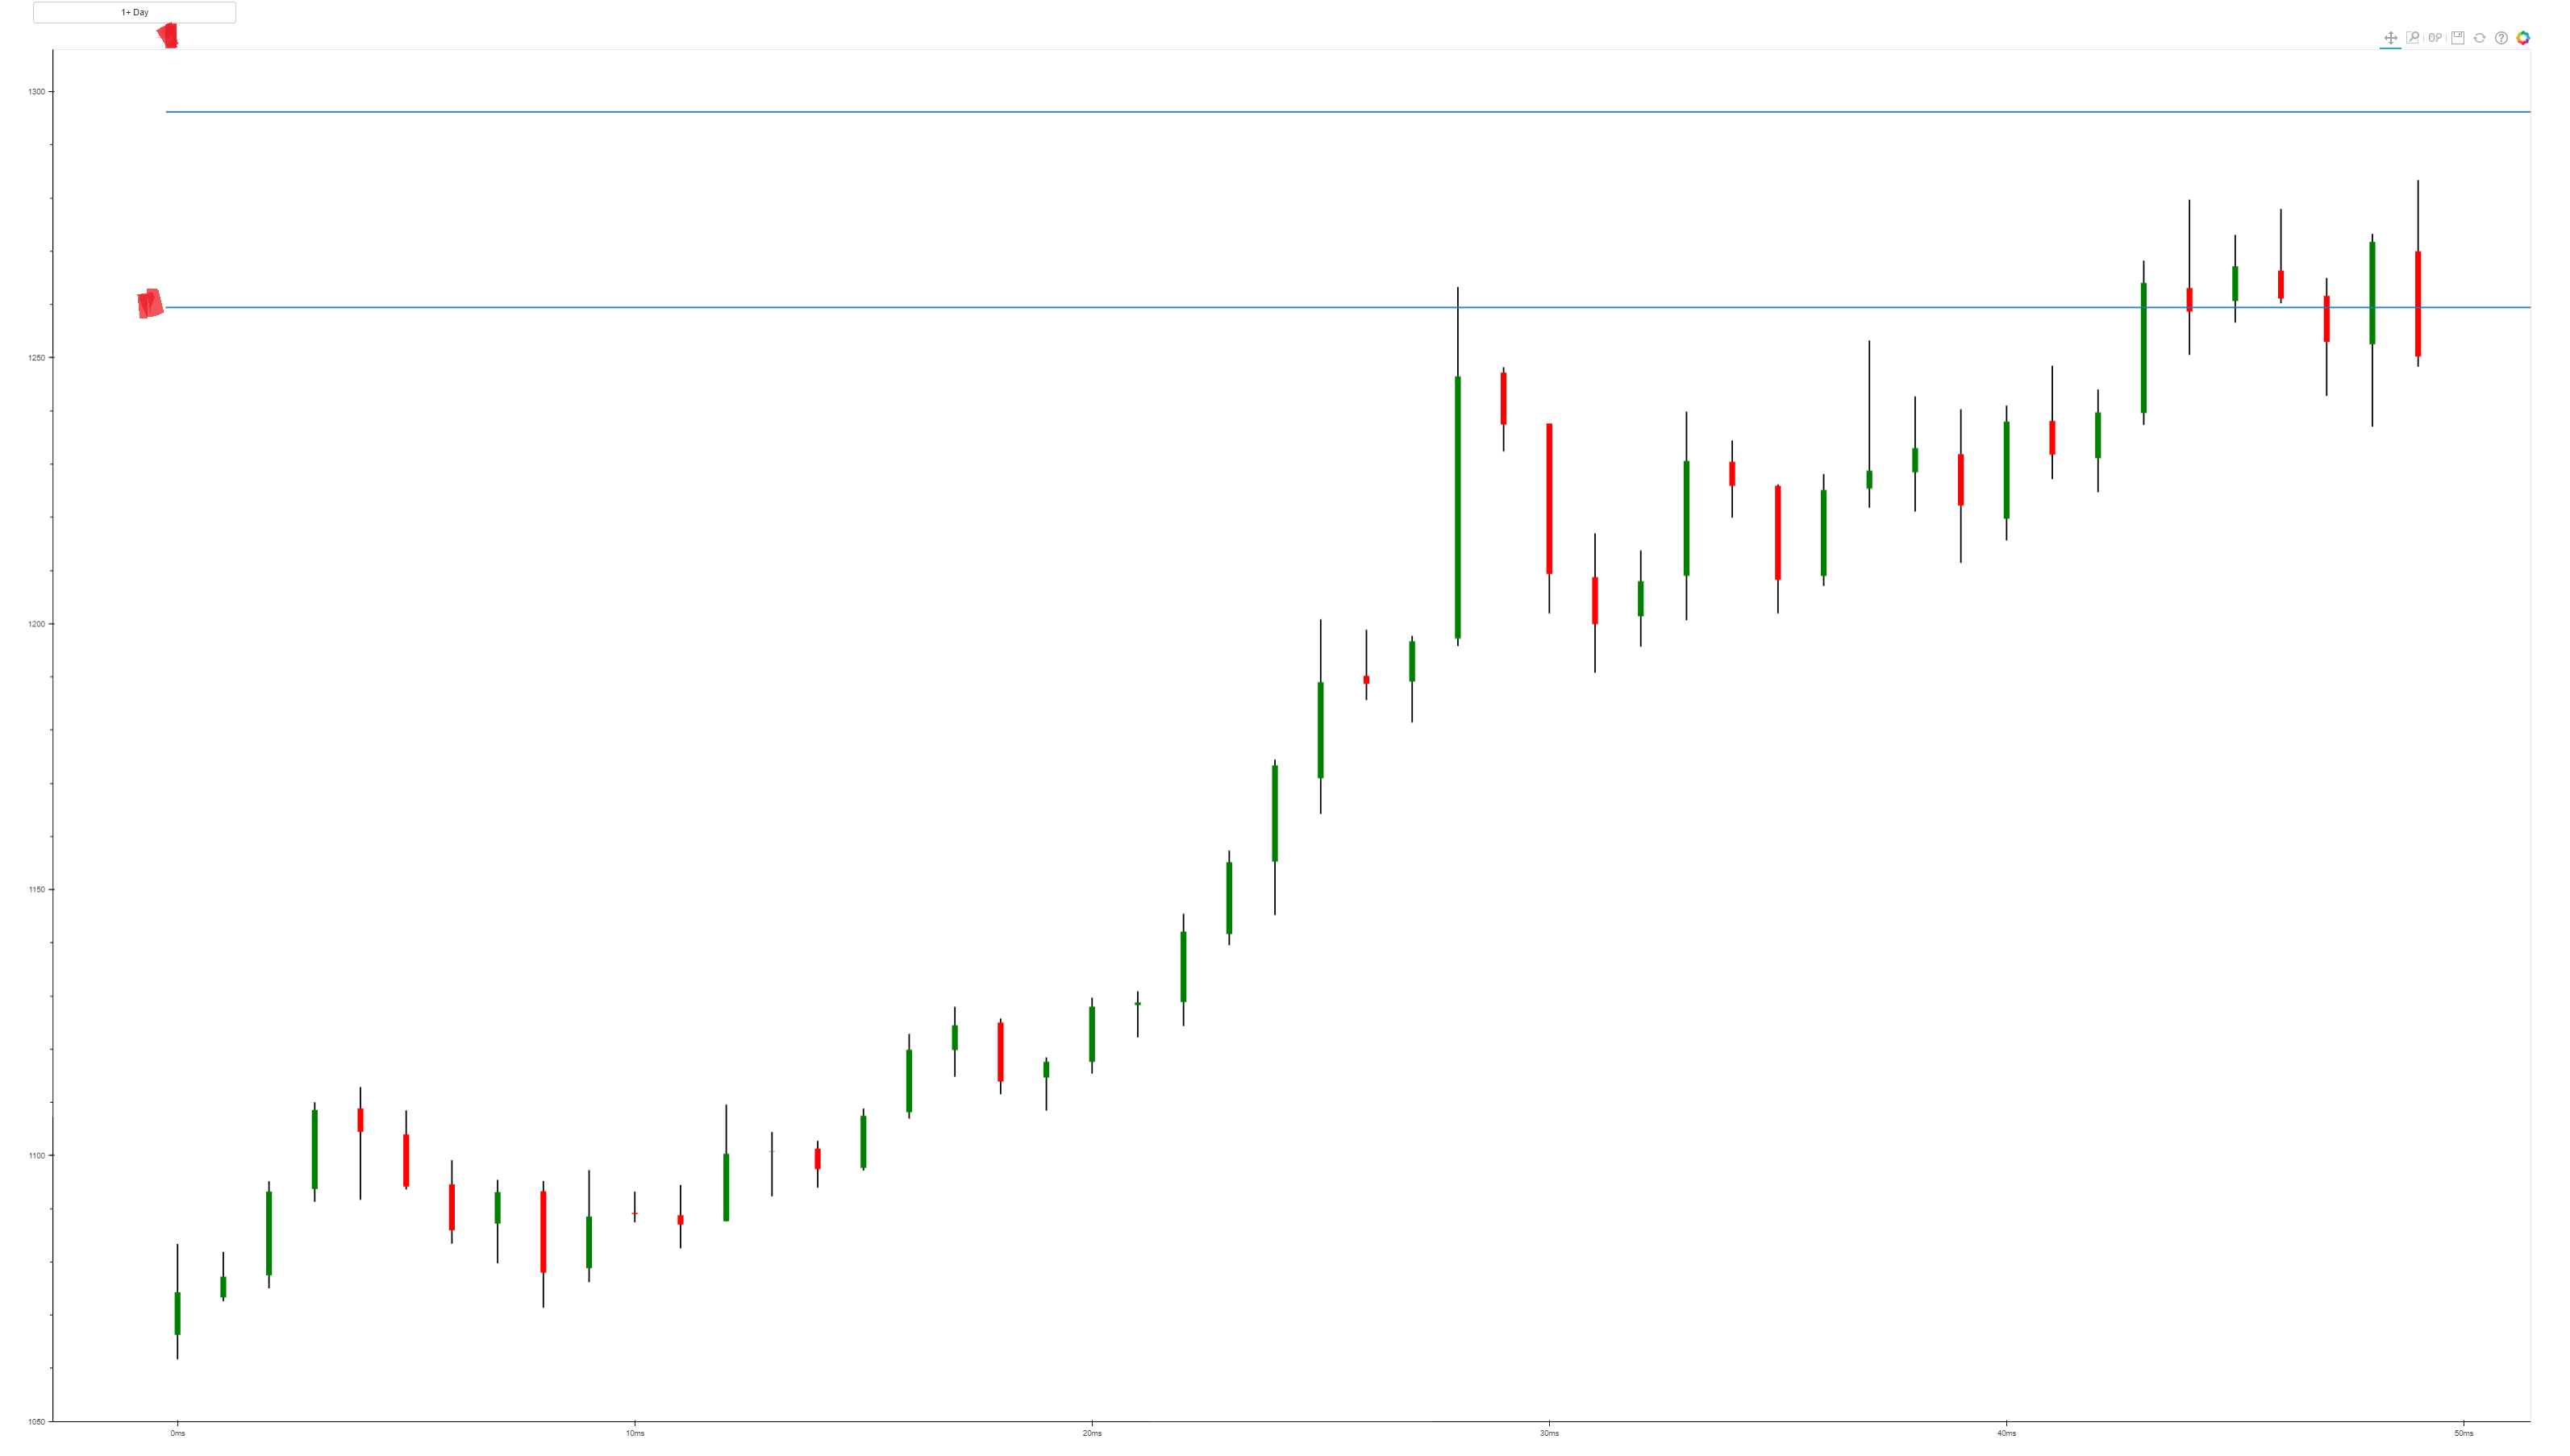
Reposting with correct image. Red point is the mouse position.

On 29 November 2017 at 16:34, Andrea Tagliabue [email protected] wrote:
Hi Guys,
very sorry to bother you again but i am seeing a very weird outcome.
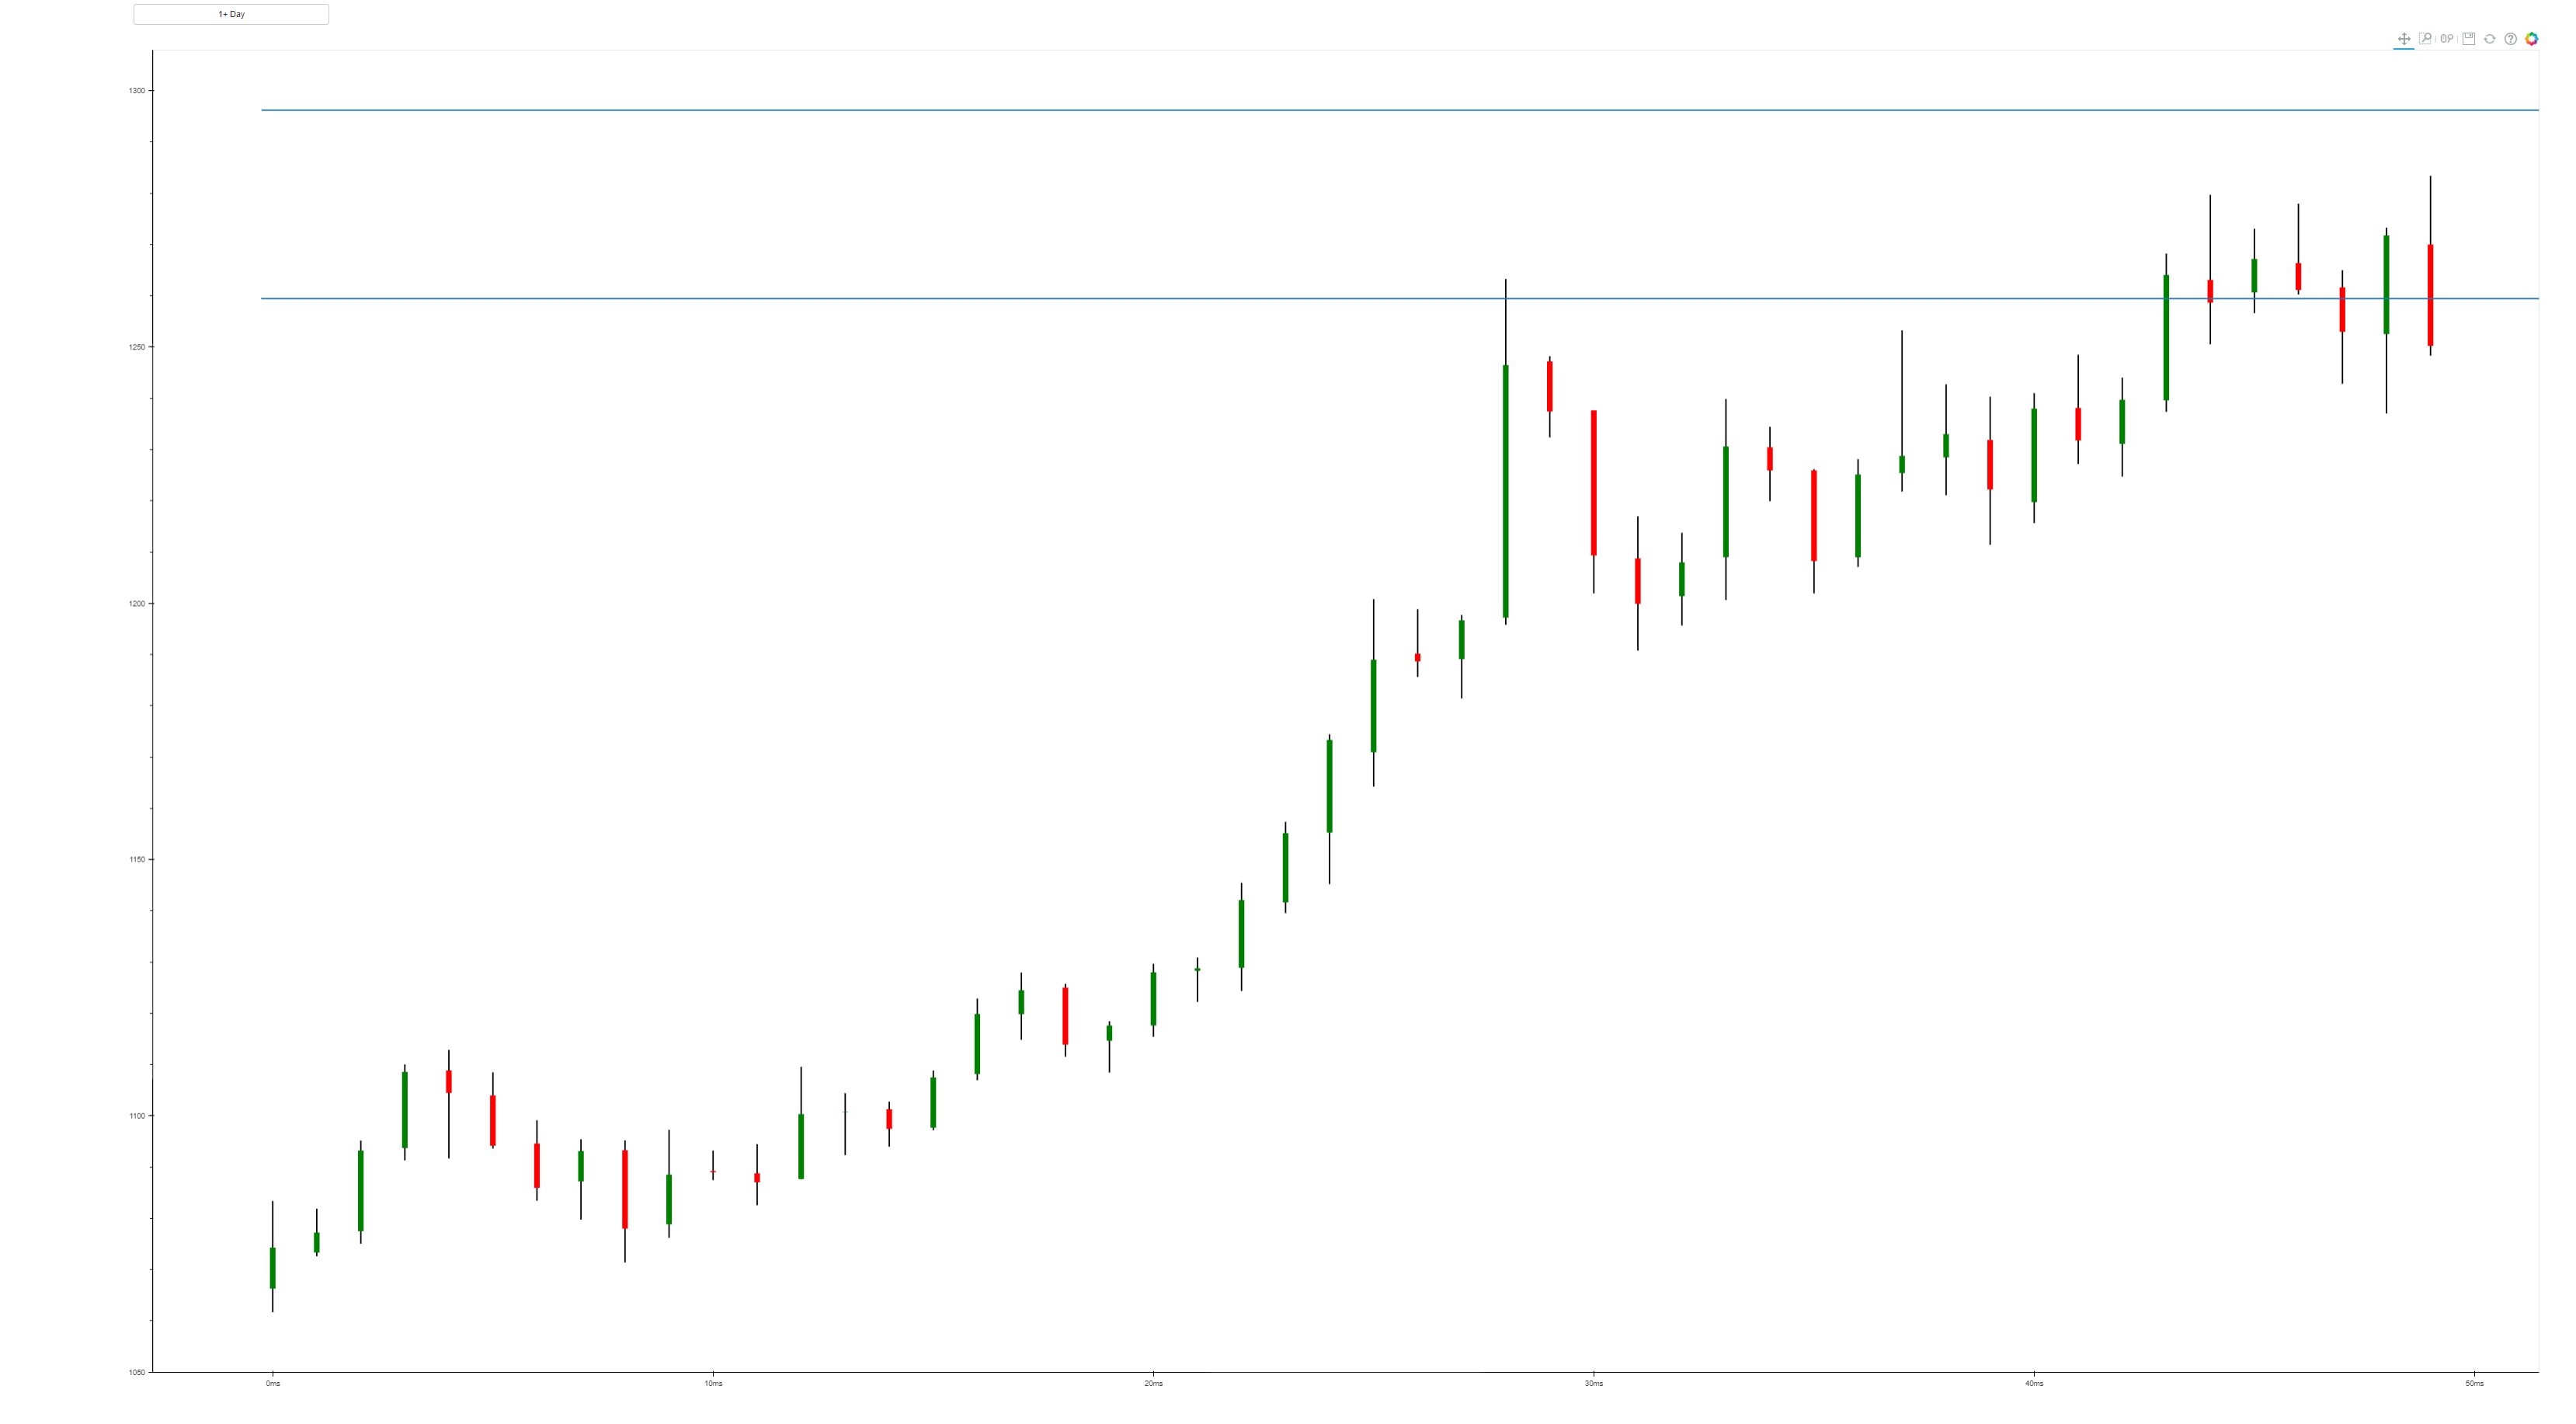
I have implemented a tap callback for drawing horizontal rays on mouse click. When i click inside the chart, as in the picture below, bokeh plots the line in the “correct” position: correct height but slightly more right for x position. Not big problem even if i would prefer an exact position.

The issue comes when the mouse is slightly ouside the chart. As in the picture i clicked in line with the toolbar but bokeh plotted a line below my mouse position. The same happens if i click any tool from the toolbar.
Do you have any idea why i see this outcome? it’s something wanted or i kind of error?
many thanks
Andrea
On 29 November 2017 at 14:58, Andrea Tagliabue [email protected] wrote:
and running the previous example for drawing lines works now!!
Virus-free. www.avast.com
On 29 November 2017 at 14:57, Andrea Tagliabue [email protected] wrote:
Hi Eugene,
yes the navigator worked fine!
On 29 November 2017 at 14:53, Eugene Pakhomov [email protected] wrote:
I can’t tell for sure, but it looks like you’ve been using the root environment for everything, and that you once upgraded all packages, including “conda” and “conda-env”, while having “conda-forge” in the list of channels.
And now that you don’t specify that channel, and apparently don’t have it in the list of default channels, it tries to install other versions from the default channel. It could really mess things up. You should learn a bit about conda environments and use them often.
If you don’t like to type stuff into the console all the time, and don’t want to spend time customizing it to your needs (since it’s especially unrewarding in the Windows console), you can also use “Anaconda Navigator” for the environment and package management. It should already be installed if you installed Anaconda.
- Eugene
On Wednesday, November 29, 2017 at 8:47:37 PM UTC+7, Andrea Tagliabue wrote:
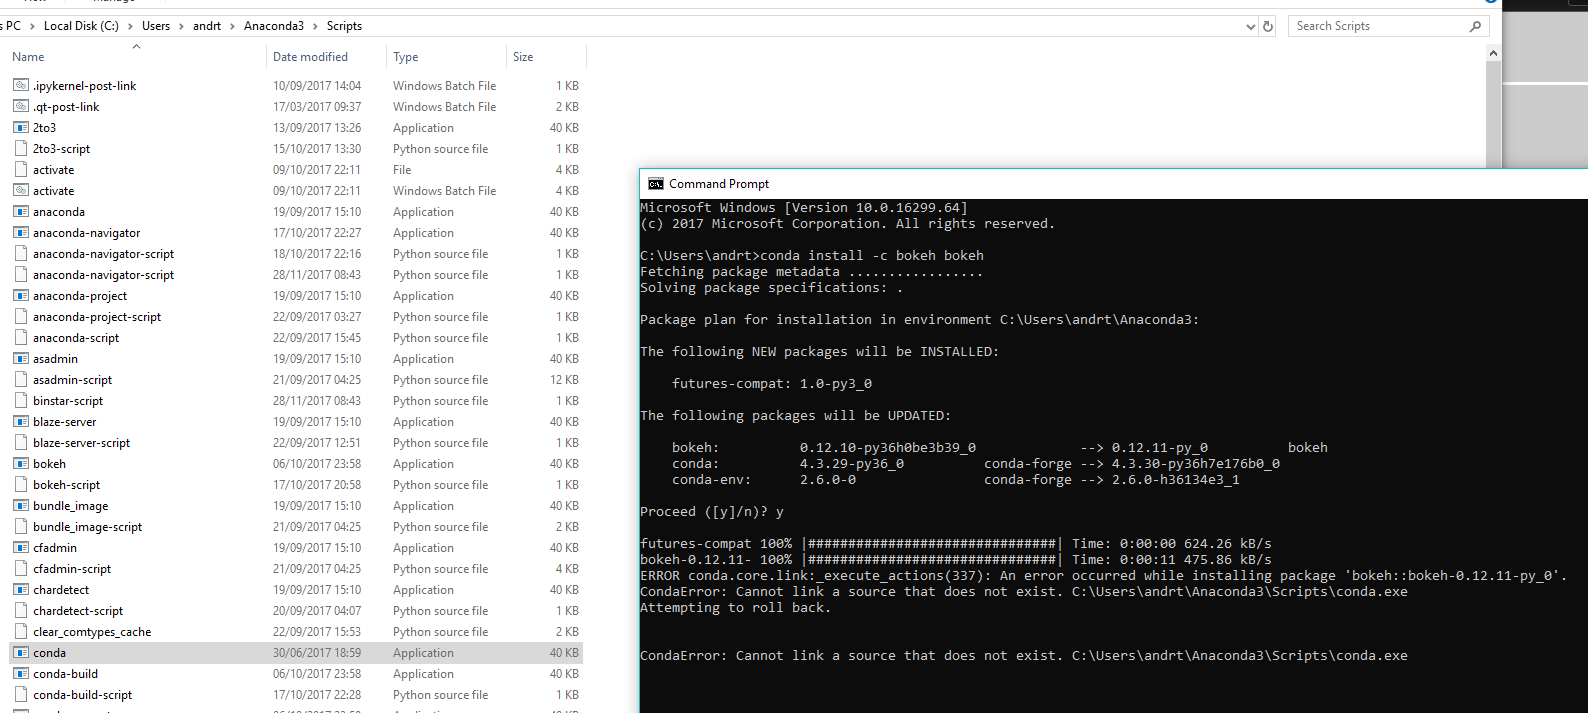
Hi,
errors in updating bokeh.

Andrea
Virus-free. www.avast.com
On 29 November 2017 at 14:39, Eugene Pakhomov [email protected] wrote:
The example has been updated to use Bokeh 0.12.11. If you still use Bokeh 0.12.10 or even older, try upgrading it.
- Eugene
On Wednesday, November 29, 2017 at 7:54:38 PM UTC+7, Andrea Tagliabue wrote:
Hi Eugene,
thanks for the tip. Looks like i should use that code into a new custom tool in order to keep multiple features such as: drawing segment, drawing horizontal/oblique rays…
I was looking at this very powerful example https://bokeh.pydata.org/en/latest/docs/user_guide/extensions_gallery/tool.html
I added these two lines
import bokeh.util.compiler
bokeh.util.compiler._npmjs = ‘npm.cmd’
and copied all the code into VS and launched but looks i still have problem with this kind of functionalities. I see the plot in the browser but the drawing functionality is completely none.
I can’t draw anything. Do you have any idea why this is happening on windows 10?Many thanks
Andrea
Virus-free. www.avast.com
On 29 November 2017 at 13:14, Eugene Pakhomov [email protected] wrote:
Hi Andrea,
You’ll have to use “ray” convenience function instead of “segment”. It creates a Ray glyph: https://bokeh.pydata.org/en/latest/docs/reference/models/glyphs/ray.html
For the length to be infinite, supply length=0 (the documentation is a bit lacking here).
You’ll also have to compute the angle from your two points {x0, y0} and {x1, y1}.
Regards,
Eugene
On Wednesday, November 29, 2017 at 5:53:55 PM UTC+7, Andrea Tagliabue wrote:
Hi all,
i have implemented Bryan’s code and everything works pretty well. I am trying to fine tuning the drawing mechanism in a proper way and i am missing a thing. I have a dynamic chart which plots an additional piece of data on request via a button. Hence, with new data appended and plotted to the chart my horizontal or oblique line stops
at the previous last displayed data. I found rays are the best tools i am looking for. Unfortunately i didn’t find any relevant doc on how to set the j_on_event for drawing the ray.
Bryan’s revised code allows me to draw and horizontal line on tap event.
s1 = ColumnDataSource(data=dict(x0=, y0=, x1=, y1=))
self.p.segment(x0=‘x0’, y0=‘y0’, x1=‘x1’, y1=‘y1’, line_dash=“solid”, line_width=2, source=s1)
self.p.js_on_event(Tap, CustomJS(args=dict(s=s1, source = source), code = “”"
s.data.x0.push(cb_obj.x)
s.data.y0.push(cb_obj.y)
s.data.x1.push(source.data.time[source.data.time.length-1]);
s.data.y1.push(cb_obj.y);
s.trigger(‘change’)
“”"))
How should i adjust it for having an horizontal or oblique ray starting from cb_obj.x and cb_obj.y?
Many thanks
Andrea
On 28 November 2017 at 17:17, Andrea Tagliabue [email protected] wrote:
Many thanks Bryan. Sharing code on that kind of ad hoc examples is vital. So i guess people can create more customised solution. Thanks again for your help!!
Andrea
Virus-free. www.avast.com
On 28 November 2017 at 17:15, Bryan Van de ven [email protected] wrote:
Perhaps going forward I will just check in any notebooks or scripts into the repo so they are at least available there for anyone that wants them.
Thanks,
Bryan
On Nov 28, 2017, at 10:14, Bryan Van de ven [email protected] wrote:
Hi,
I have not done a good job of sharing the code behind the blog posts. I find that the posts read better with snippets. I’d like to find a way to link to or include the full code behind a scroller or something but I have not had the opportunity yet. However, the code for that example is roughly below (it may be missing some imports as it was scattered across a notebook with other examples).
import numpy as np
from bokeh.events import *
from bokeh.io import output_notebook, show
from bokeh.models import ColumnDataSource, CustomJS
from bokeh.plotting import figure
output_notebook()
p = figure(x_range=(0,10), y_range=(0,10), x_axis_location=None, y_axis_location=None, tools=“”, toolbar_location=None)
p.plot_height = 300
p.title.text = ‘Drag to draw lines, Tap to drop Circles, Double Tap to reset’
p.grid.grid_line_color = None
p.background_fill_color = ‘#f5f5f5’
s1 = ColumnDataSource(data=dict(x=, y=, c=))
p.circle(‘x’, ‘y’, color=‘c’, size=20, alpha=0.4, source=s1)
s2 = ColumnDataSource(data=dict(x0=, y0=, x1=, y1=))
p.segment(x0=‘x0’, y0=‘y0’, x1=‘x1’, y1=‘y1’, line_dash=“dashed”, line_width=2, source=s2)
p.js_on_event(Tap, CustomJS(args=dict(s=s1), code=“”"
s.data.x.push(cb_obj.x)s.data.y.push(cb_obj.y)s.data.c.push('#' + (Math.random().toString(16) + "000000").substring(2,8))s.trigger('change')“”"))
p.js_on_event(PanStart, CustomJS(code=“”"
window._p0 = {x: cb_obj.x, y: cb_obj.y}“”"))
p.js_on_event(Pan, CustomJS(args=dict(s=s2), code=“”"
if (window._p0 != null) {s.data.x0.push(window._p0.x);s.data.y0.push(window._p0.y);s.data.x1.push(cb_obj.x);s.data.y1.push(cb_obj.y);window._p0 = null;} else {s.data.x1[s.data.x1.length-1] = cb_obj.xs.data.y1[s.data.y1.length-1] = cb_obj.y}s.trigger('change')“”"))
p.js_on_event(DoubleTap, CustomJS(args=dict(s1=s1, s2=s2), code=“”"
s1.data.x = []s1.data.y = []s1.data.c = []s1.trigger('change')s2.data.x0 = []s2.data.y0 = []s2.data.x1 = []s2.data.y1 = []s2.trigger('change')“”"))
show(p)
On Nov 28, 2017, at 09:40, Andrea Tagliabue [email protected] wrote:
oh I see. Well i will try my best. Any help much appreciated!
Thanks
Andrea
Virus-free. [www.avast.com](http://www.avast.com)On 28 November 2017 at 16:30, Eugene Pakhomov [email protected] wrote:
Hi Andrea,
The code that creates that box is in https://github.com/bokeh/bokeh.github.io/blob/source/content/blog/release-0-12-5/events.js
However, this JS was generated by the code that appears to be missing in the repository. I’m afraid you’ll have to decipher the JS yourself unless someone else will share it.
Here you can find an example on how to draw arbitrary shapes with mouse: https://bokeh.pydata.org/en/latest/docs/user_guide/extensions_gallery/tool.html
For future reference, the code for the whole blog is at https://github.com/bokeh/bokeh.github.io
Regards,
Eugene
On Tuesday, November 28, 2017 at 10:16:37 PM UTC+7, Andrea Tagliabue wrote:
Hi all,
i have found an amazing example at https://bokeh.github.io/blog/2017/4/5/release-0-12-5/
I was looking for a way to have mouse control for drawing oblique/horizontal lines. The example below JS and Python callbacks for general UI events is what i was really looking for.
I tried to replicate the same outcome but i am very far away from achieving the same outcome. Is it possible to get the code for that specific box?
Many thanks,
Andrea
–
You received this message because you are subscribed to the Google Groups “Bokeh Discussion - Public” group.
To unsubscribe from this group and stop receiving emails from it, send an email to [email protected].
To post to this group, send email to [email protected].
To view this discussion on the web visit https://groups.google.com/a/continuum.io/d/msgid/bokeh/9a587f26-c7a5-4150-8f68-7962529a2292%40continuum.io.
For more options, visit https://groups.google.com/a/continuum.io/d/optout.
–
You received this message because you are subscribed to the Google Groups “Bokeh Discussion - Public” group.
To unsubscribe from this group and stop receiving emails from it, send an email to [email protected].
To post to this group, send email to [email protected].
To view this discussion on the web visit https://groups.google.com/a/continuum.io/d/msgid/bokeh/CAKUye6D9Ox5kY0i-rwRQpPZo%2BUYMT-0gVqt5HSiK03VTT3HdrA%40mail.gmail.com.
For more options, visit https://groups.google.com/a/continuum.io/d/optout.
–
You received this message because you are subscribed to the Google Groups “Bokeh Discussion - Public” group.
To unsubscribe from this group and stop receiving emails from it, send an email to [email protected].
To post to this group, send email to [email protected].
To view this discussion on the web visit https://groups.google.com/a/continuum.io/d/msgid/bokeh/1F7AC052-1F45-4D45-AF9A-83EFD52BB981%40anaconda.com.
For more options, visit https://groups.google.com/a/continuum.io/d/optout.
–
You received this message because you are subscribed to the Google Groups “Bokeh Discussion - Public” group.
To unsubscribe from this group and stop receiving emails from it, send an email to [email protected].
To post to this group, send email to [email protected].
To view this discussion on the web visit https://groups.google.com/a/continuum.io/d/msgid/bokeh/ee918ec3-80d7-4225-9ab5-a09612c44112%40continuum.io.
For more options, visit https://groups.google.com/a/continuum.io/d/optout.
–
You received this message because you are subscribed to the Google Groups “Bokeh Discussion - Public” group.
To unsubscribe from this group and stop receiving emails from it, send an email to [email protected].
To post to this group, send email to [email protected].
To view this discussion on the web visit https://groups.google.com/a/continuum.io/d/msgid/bokeh/4fff8c65-850e-40e6-b6dc-1df6aed2df55%40continuum.io.
For more options, visit https://groups.google.com/a/continuum.io/d/optout.
–
You received this message because you are subscribed to the Google Groups “Bokeh Discussion - Public” group.
To unsubscribe from this group and stop receiving emails from it, send an email to [email protected].
To post to this group, send email to [email protected].
To view this discussion on the web visit https://groups.google.com/a/continuum.io/d/msgid/bokeh/675981e3-5bdd-4077-ad63-7b9bf9bed7e2%40continuum.io.
For more options, visit https://groups.google.com/a/continuum.io/d/optout.
–
You received this message because you are subscribed to the Google Groups “Bokeh Discussion - Public” group.
To unsubscribe from this group and stop receiving emails from it, send an email to [email protected].
To post to this group, send email to [email protected].
To view this discussion on the web visit https://groups.google.com/a/continuum.io/d/msgid/bokeh/fa381378-b510-4332-8903-15570e1cb497%40continuum.io.
For more options, visit https://groups.google.com/a/continuum.io/d/optout.