
Hello,
I have a vbar graph in which I’m using conditional colors for each bar. I was hoping I could put a legend on the graph that gives a description of what each color means.
Shortened code:
xAxis=[1, 2, 3, 4, 5]
precipchance=[40,50,60,30,40]
condColor=['red', 'green', 'blue', 'green', 'red']
p.vbar(x=xAxis, top=precipchance, color=condColor)
Produces:
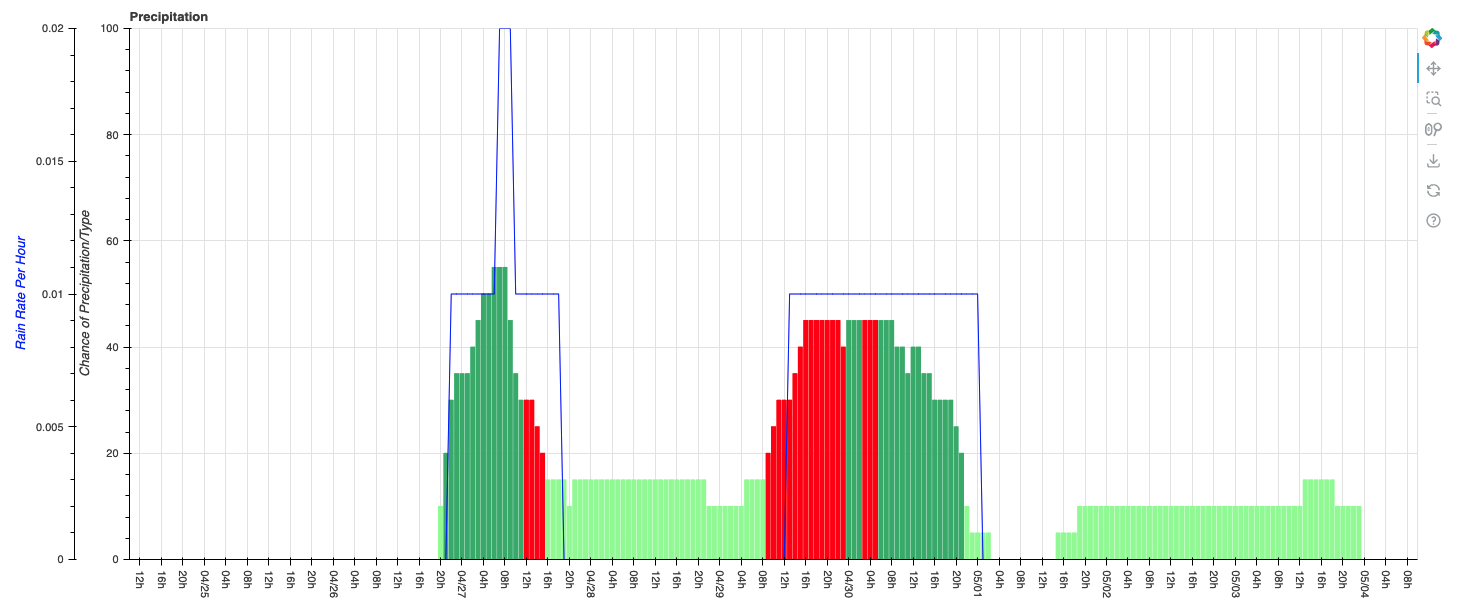
I would like the legend to have a red square = “Thunderstorms”, green square = “Rain”, etc.
Is something like this possible?