
☰Read-only archive⌕
Looking for help with Bokeh?

This is a read-only archive. Ask questions and join the conversation on GitHub.

Visit Community Support on GitHub →
Archived discussions · Captured October 28, 2026

Data table had many blank rows if multiselect has 4 or more values

Community Support
Ross_D
Ross_D

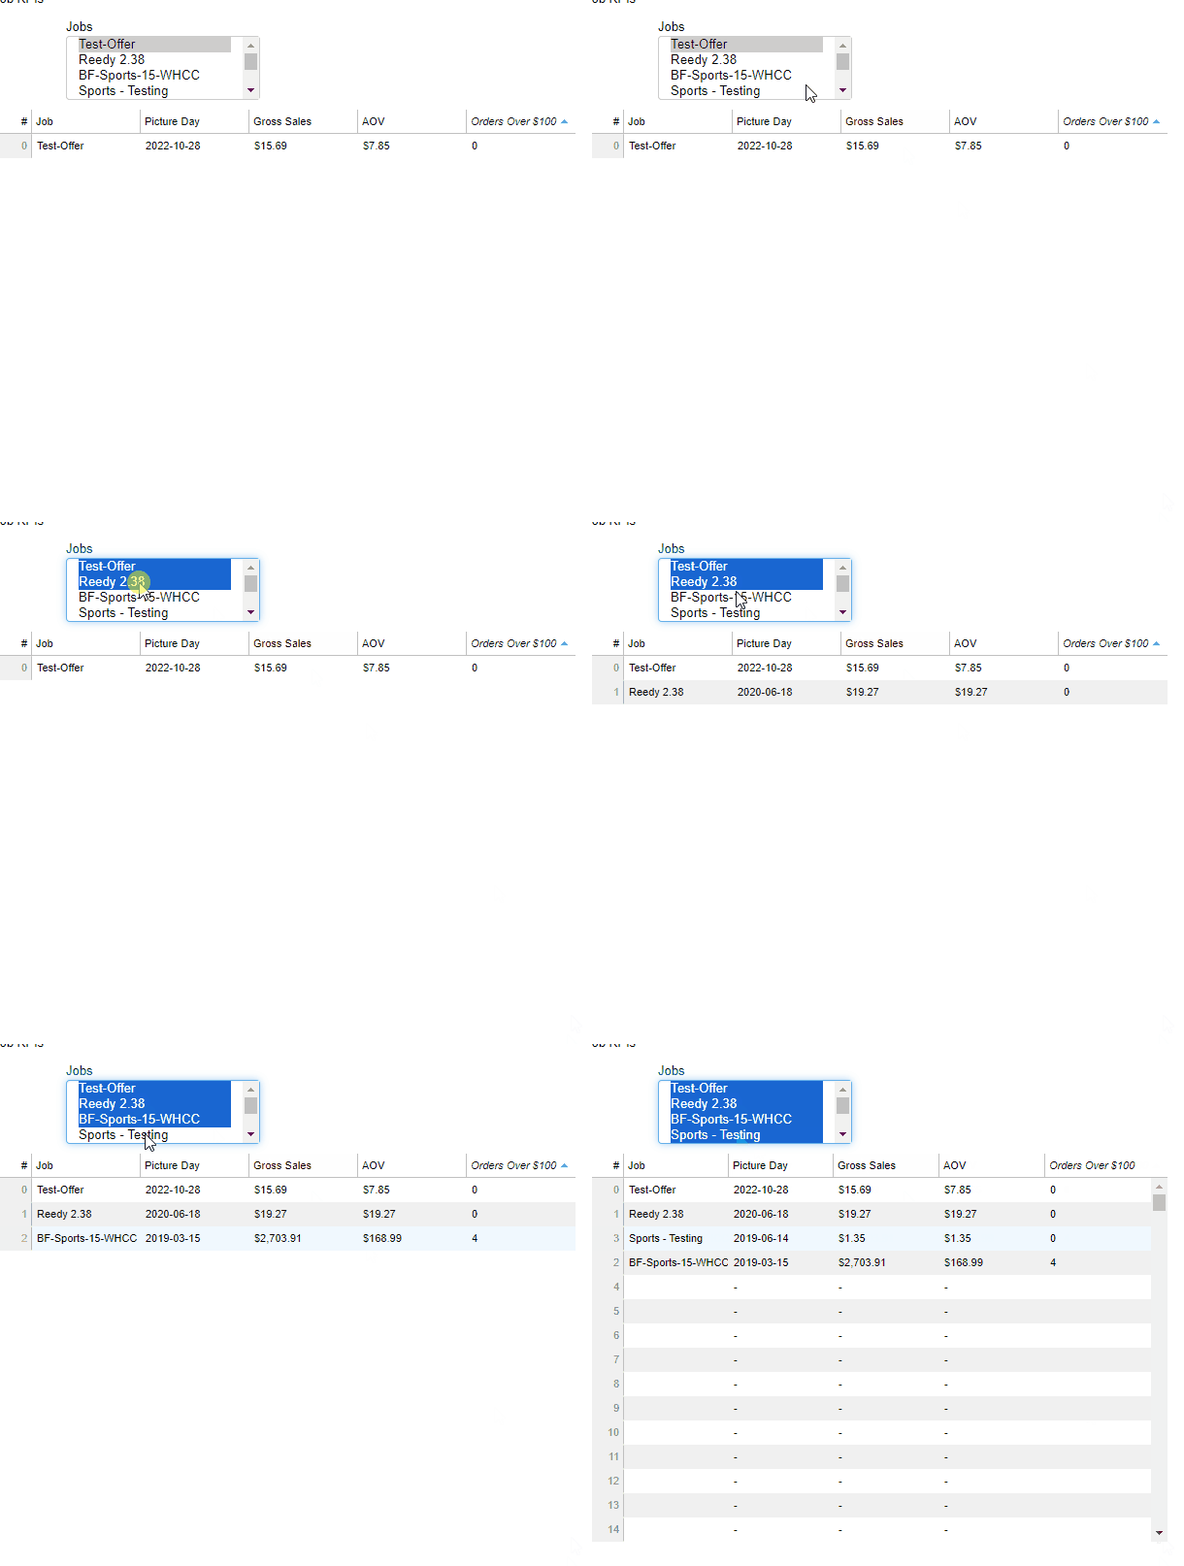
I am trying to make a table with a multiselect widget so that only rows that match the multiselect appear. This works perfectly well when 1-3 values are selected but, for some reason, when a 4th is selected it shows the complete table size (308 rows) with the unselected rows being blank.
bokeh_blank_rows

output_notebook()

output_file('testy.html')

jobs = orders_df['job'].unique().tolist()

source = ColumnDataSource(aggregate_orders_df)
source_col_names = [column for column in aggregate_orders_df]
# create a ColumnDataSource containing all the necessary data so that I can send it to javascript for filtering
all_source = ColumnDataSource(aggregate_orders_df)

columns = [
    TableColumn(field='job', title='Job'),
    TableColumn(field='picture_day', title='Picture Day', formatter=DateFormatter()),
    TableColumn(field='gross_sales', title='Gross Sales', formatter=NumberFormatter(format='$0,0.00')),
    TableColumn(field='aov', title='AOV', formatter=NumberFormatter(format='$0,0.00')),
    TableColumn(field='pd100_count', title='Orders Over $100')
    ]

myTable = DataTable(source=source, columns=columns)

# create the dropdown menu 
job_select = MultiSelect(title = 'Jobs', 
    value = jobs,
    options = aggregate_orders_df['job'].unique().tolist(),
    width = 200,
    margin = (5, 5, 5, 80)
)


# Javascript code for the callback
callback = CustomJS(
    args = dict(
        source = source, 
        all_source = all_source,
        job_select = job_select,
        source_col_names = source_col_names
    ),
    code = 
    """
        // get the value from the dropdown
        var jobs = job_select.value;
        console.log(source.data);
        for (let key in source_col_names) {
            let col_name = source_col_names[key];
            source.data[col_name] = all_source.data[col_name].filter(function(d,i){return jobs.includes(all_source.data.job[i])});
        }
        source.change.emit();
        
    """
)

#attach the callback 
job_select.js_on_change('value', callback)

show(
    column(
        [
            Div(text = 'Job KPIs'), 
            job_select,
            myTable
        ]
    )
)

⌁   Link to post
Ross_D
Ross_D

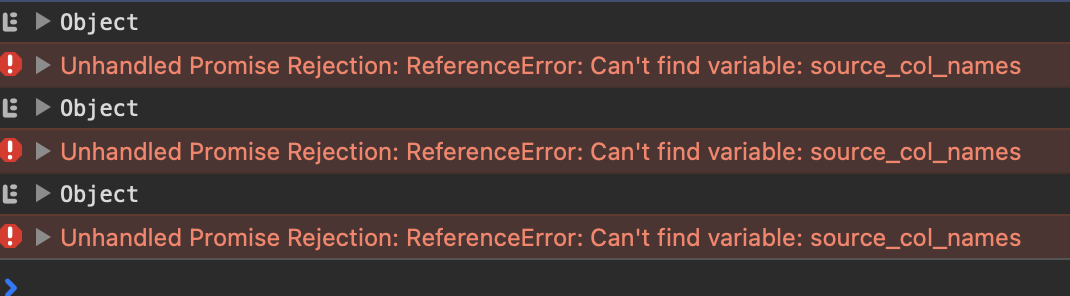
with imports and random data still get the same issue

from bokeh.plotting import *
from bokeh.layouts import column
from bokeh.models import ColumnDataSource, CustomJS, Select, RadioButtonGroup, Div, HoverTool, MultiSelect, TableColumn, DataTable, DateFormatter, NumberFormatter
import numpy as np
import pandas as pd

output_notebook()

orders_df = pd.DataFrame(range(0,300), columns=['job'])
orders_df['job'] = orders_df['job'].astype(str)
jobs = orders_df['job'].unique().tolist()
aggregate_orders_df = pd.DataFrame(np.random.randint(0,100,size=(300, 4)), columns=['picture_day','gross_sales','aov','pd100_count'])
aggregate_orders_df = orders_df.join(aggregate_orders_df)

source = ColumnDataSource(aggregate_orders_df)
source_col_names = [column for column in aggregate_orders_df]

all_source = ColumnDataSource(aggregate_orders_df)

columns = [
    TableColumn(field='job', title='Job'),
    TableColumn(field='picture_day', title='Picture Day', formatter=DateFormatter()),
    TableColumn(field='gross_sales', title='Gross Sales', formatter=NumberFormatter(format='$0,0.00')),
    TableColumn(field='aov', title='AOV', formatter=NumberFormatter(format='$0,0.00')),
    TableColumn(field='pd100_count', title='Orders Over $100')
    ]

myTable = DataTable(source=source, columns=columns)

job_select = MultiSelect(title = 'Jobs', 
    value = jobs,
    options = aggregate_orders_df['job'].unique().tolist(),
    width = 200,
    margin = (5, 5, 5, 80)
)


callback = CustomJS(
    args = dict(
        source = source, 
        all_source = all_source,
        job_select = job_select,
        source_col_names = source_col_names),
    code = 
    """
        // get the value from the dropdown
        var jobs = job_select.value;
        console.log(source.data);
        for (let key in source_col_names) {
            let col_name = source_col_names[key];
            source.data[col_name] = all_source.data[col_name].filter(function(d,i){return jobs.includes(all_source.data.job[i])});
        }
        source.change.emit();
        
    """
)

#attach the callback 
job_select.js_on_change('value', callback)

show(
    column(
        [
            Div(text = 'Job KPIs'), 
            job_select,
            myTable
        ]
    )
)
⌁   Link to post
Ross_D
Ross_D

copy-pasting code that I’m certain runs without anything else.
I forgot to execute on a new kernel so there were some set variables in the last one but this time that’s resolved. Sorry for the goose-chase.

from bokeh.plotting import *
from bokeh.layouts import column
from bokeh.models import ColumnDataSource, CustomJS, Select, RadioButtonGroup, Div, HoverTool, MultiSelect, TableColumn, DataTable, DateFormatter, NumberFormatter
import numpy as np
import pandas as pd

output_notebook()
output_file('testy.html')
orders_df = pd.DataFrame(range(0,300), columns=['job'])
orders_df['job'] = orders_df['job'].astype(str)
jobs = orders_df['job'].unique().tolist()
aggregate_orders_df = pd.DataFrame(np.random.randint(0,100,size=(300, 4)), columns=['picture_day','gross_sales','aov','pd100_count'])
aggregate_orders_df = orders_df.join(aggregate_orders_df)

source = ColumnDataSource(aggregate_orders_df)
source_col_names = [column for column in aggregate_orders_df]

all_source = ColumnDataSource(aggregate_orders_df)

columns = [
    TableColumn(field='job', title='Job'),
    TableColumn(field='picture_day', title='Picture Day', formatter=DateFormatter()),
    TableColumn(field='gross_sales', title='Gross Sales', formatter=NumberFormatter(format='$0,0.00')),
    TableColumn(field='aov', title='AOV', formatter=NumberFormatter(format='$0,0.00')),
    TableColumn(field='pd100_count', title='Orders Over $100')
    ]

myTable = DataTable(source=source, columns=columns)

job_select = MultiSelect(title = 'Jobs', 
    value = jobs,
    options = aggregate_orders_df['job'].unique().tolist(),
    width = 200,
    margin = (5, 5, 5, 80)
)


jobs_callback = CustomJS(
    args = dict(
        source = source, 
        all_source = all_source,
        job_select = job_select,
        source_col_names = source_col_names),
    code = 
    """
        // get the value from the dropdown
        var jobs = job_select.value;
        console.log(source.data);
        for (let key in source_col_names) {
            let col_name = source_col_names[key];
            source.data[col_name] = all_source.data[col_name].filter(function(d,i){return jobs.includes(all_source.data.job[i])});
        }
        source.change.emit();
        
    """
)

#attach the callback 
job_select.js_on_change('value', jobs_callback)

show(
    column(
        [
            Div(text = 'Job KPIs'), 
            job_select,
            myTable
        ]
    )
)
⌁   Link to post
Bryan
Bryan

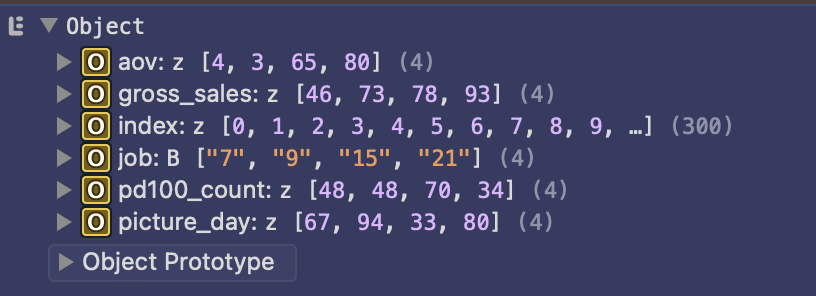
@Ross_D I believe your console.log reveals the source of the problem:

Your index column still has 300 rows while the others have only a few rows. Columns in a CDS are assumed to always have identical numbers of rows. Anything else is undefined behavior.

Edit: just to note, the index column is present because you creating a CDS out of a DataFrame, and DataFrames have an index column, even if it is not named (if the index column does have a name, that will be used instead of generic “index”). If you don’t want that column, you could delete it. Otherwise, you will need to handle it along with all the others.

⌁   Link to post
Ross_D
Ross_D

Interesting. That’s the solution but I do wonder why the number of selections matters in this case. I was thrown off by the fact that the table appeared as desired for 1-3 selections.
Regardless my issue is solved. Thanks

⌁   Link to post

End of archived discussion · Replies are disabled
