

Hi,
I’m trying to create a plot where x coordinates are datetime.date objects and y are integers. The code looks like this:
p.x_range = Range1d()
p.xaxis[0].formatter = DatetimeTickFormatter(formats=dict(
    hours=["%Y-%m-%d"],
    days=["%Y-%m-%d"],
    months=["%Y-%m-%d"],
    years=["%Y-%m-%d"],
))
p.xaxis[0].ticker = DatetimeTicker()
p.xgrid[0].ticker = DatetimeTicker()
x axis get updated every time d_start changes
def update(…):
d_range = pd.date_range(d_start, periods=30, freq='D').date.tolist()
    p.x_range.start = d_range[0]
    p.x_range.end = d_range[-1]
    p.xaxis[0].ticker = DatetimeTicker(desired_num_ticks=len(d_range), tags=d_range)
    p.xgrid[0].ticker = DatetimeTicker(desired_num_ticks=len(d_range), tags=d_range)
The first problem is there are multiples (12 or 24 when zoom in to maximum) ticks of the same day on the axis and the glyph is plotted along only one tick. I want to have one tick a day.
Additionally, is there a way to adjust the distance between the first tick on x axis and y axis. At the moment the first tick is at y axis so the tick label is missing as well.
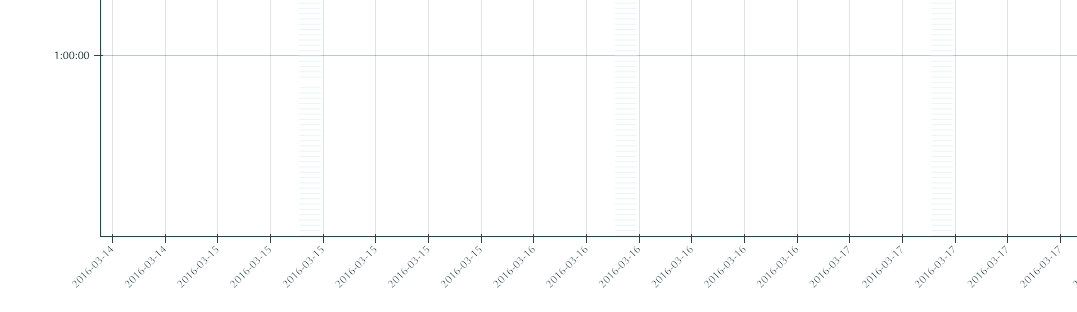
Many thanks in advance!
Caroline

