

Hi all,
I’m implementing a dynamic (i.e., asynchronous) trend dealing with time series having the same length (due to the ColumnDataSource constraint) but different sampling frequencies. It works nicely. However, its behaviour is a bit weird and surprising for the user. The following screenshot shows what you obtain with 3 data sources respectively sampled at 250ms (blue), 500ms (red) and 1s (green).
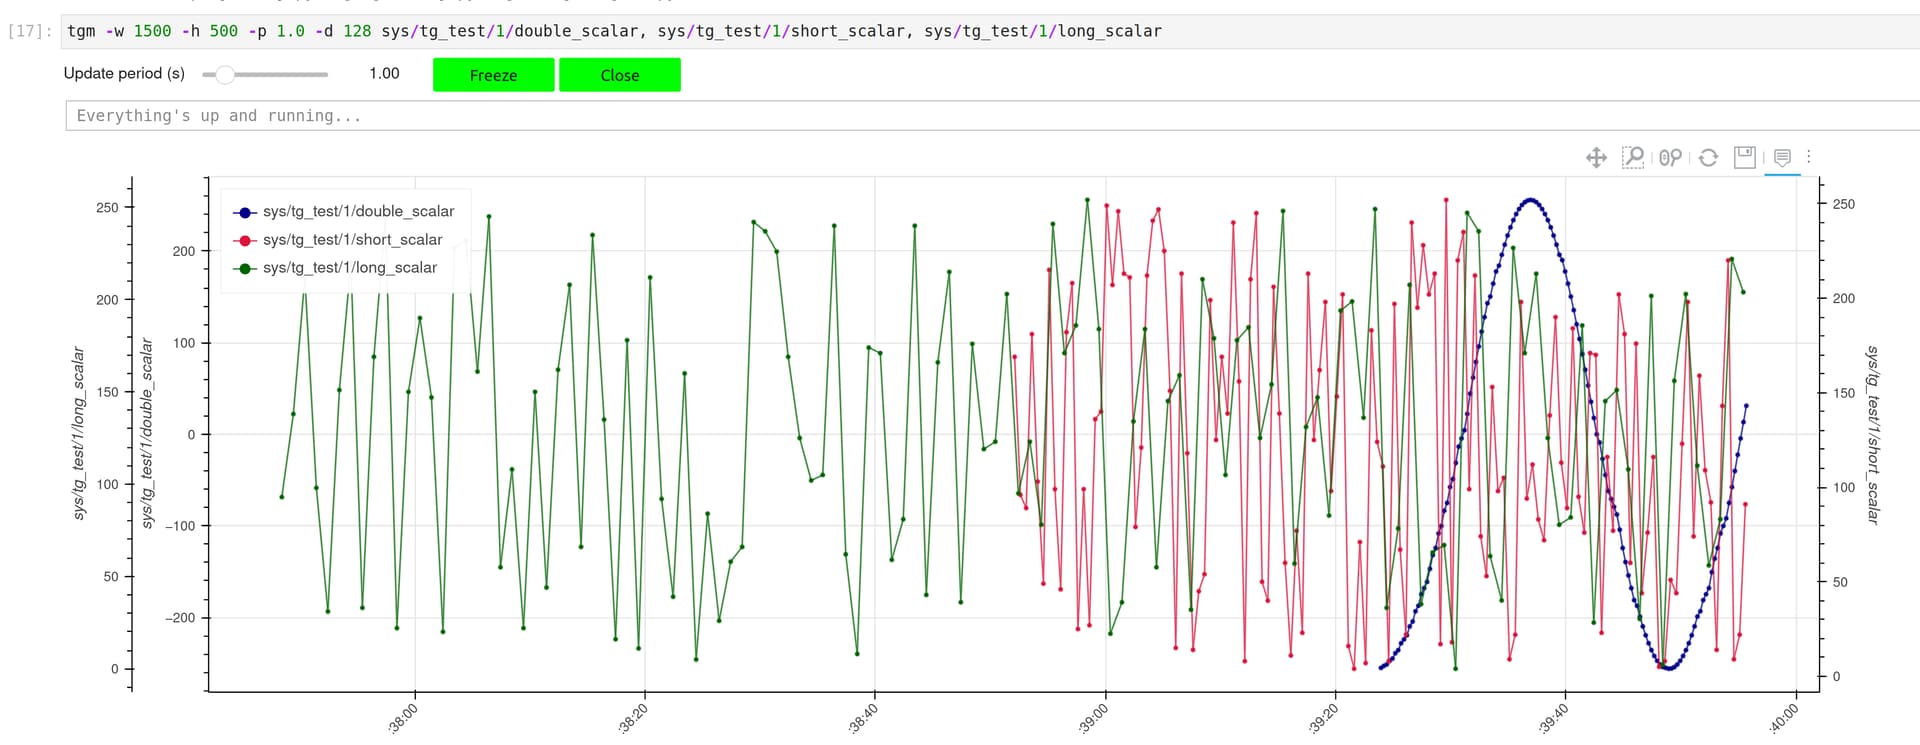
This behaviour is expected and related to the fact that we are using the same buffer length to display the “history” of each signal.
The question is, how could I change the implementation so that the 3 signals “spread” over the full plot? In other words, how can I deal with columns having different length?
It seems that MultiLine could be a solution but I don’t see how to keep the individual signal legend and the related show/hide feature. And, what about the hover behaviour?
Thanks for your help.

