Hi,
I am trying to produce a plot in a Jupyter notebook with an autocomplete input text box that the user could use to display the formatted label of a given glyph.
So far, I have been able to change the value of the displayed label with the value parameter of autocomplete input, but I cannot figure out how to modify the autocomplete input tags to change the coordinates and color of the label.
I attempted to use SetValue but get this error: ValueError: not all callback values are CustomJS instances. As I am new to JavaScript, I was wondering if this achievable with CustomJS? Or maybe with another way?
Below is my attempt with a small dataset:
import pandas as pd
import numpy as np
from bokeh.io import output_notebook, output_file, show, curdoc
from bokeh.models import HoverTool, Patches, ColumnDataSource, Label, CustomJS, SetValue, AutocompleteInput
from bokeh.plotting import figure
from bokeh.layouts import layout

output_notebook()

test_df = pd.DataFrame({"Label": ["METDI0001", "METDI0002", "METDI0003", "METDI0004", "METDI0005"],
                        "Begin": [710, 2535, 3697, 4855, 5259],
                        "Length": [1506, 1122, 1155, 405, 240],
                        "Color": ["black", "black", "#FF9E0A", "#259AFF", "lightgrey"]})

## Arrow coordinates to draw glyphs
xpts = np.array([0, 0, 0.5, 0.5,  1, 0.5, 0.5])
ypts = np.array([-0.1,  0.1, 0.1, 0.21, 0, -0.21, -0.1])

test_df["xs"] = ""
test_df["ys"] = ""

for index in test_df.index:
    test_df.at[index, "xs"] = (xpts*(test_df.loc[index, "Length"]) + test_df.loc[index, "Begin"]).tolist()
    test_df.at[index, "ys"] = ypts

p = figure(width=1000, height=300, x_range=(0, 7000), y_range=(-1, 1), toolbar_location="right",
           tools="pan,xwheel_zoom,save,reset", active_scroll="xwheel_zoom")

p.xaxis.axis_label = "coordinates (bp)"
p.xaxis.bounds = (0, 7000)
p.yaxis.ticker = []


# Plot gene models
glyph = Patches(xs="xs", ys="ys", fill_color="Color", line_color="Color")
source = ColumnDataSource(test_df)
g_gene = p.add_glyph(source, glyph)

p.add_tools(HoverTool())
hover = p.select(dict(type=HoverTool))
hover.tooltips = [("Accession", "@{Label}"),
                  ("gene length", "@{Length} nt")]
hover.mode = 'mouse'


# Label input from user
text_input = AutocompleteInput(completions=test_df["Label"].tolist(), value="METDI0001", title="enter gene label", min_characters=7)
text_input.tags = [test_df.loc[test_df["Label"] == text_input.value, "Begin"].values[0],
                   test_df.loc[test_df["Label"] == text_input.value,"Color"].values[0]]

# This SetValue callback cause en error
#callback = SetValue(obj=text_input, attr="tags", value=[(test_df.loc[test_df["Label"] == text_input.value, "Begin"].values[0] +
#                    test_df.loc[test_df["Label"] == text_input.value,"Length"].values[0]/5),
#                   test_df.loc[test_df["Label"] == text_input.value,"Color"].values[0]])

callback = CustomJS(args=dict(source=source), code="""
    // I would like to modify the tags of text_input to be able
    // to change the x and color parameters of the displayed label
    """)

text_input.js_on_change("value", CustomJS(code="""
    console.log('text_input: value=' + this.value, this.toString())
"""))
text_input.js_on_change("value", callback)

lab = Label(x=text_input.tags[0], y=0.5, text=text_input.value, text_font_size="14px", text_color=text_input.tags[1])
p.add_layout(lab)

text_input.js_link("value", lab, "text")
text_input.js_link("tags", lab, "x", 0)
text_input.js_link("tags", lab, "text_color", 1)

show(layout([p], [text_input]))
This is what I would like to get:
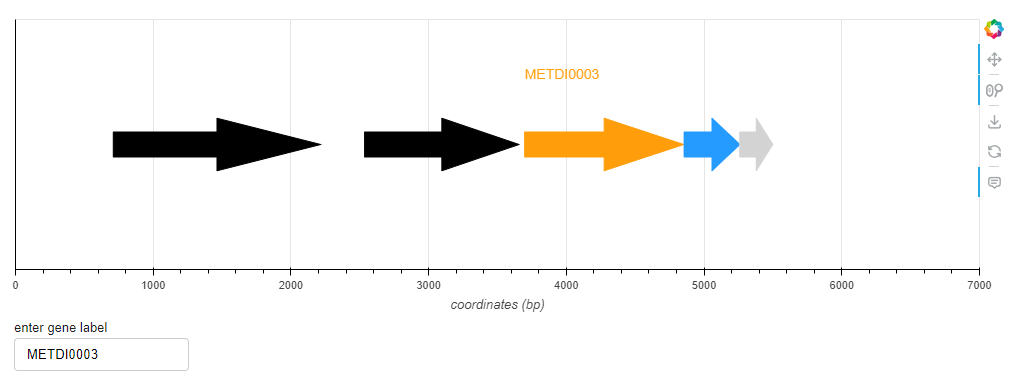
Thank you.