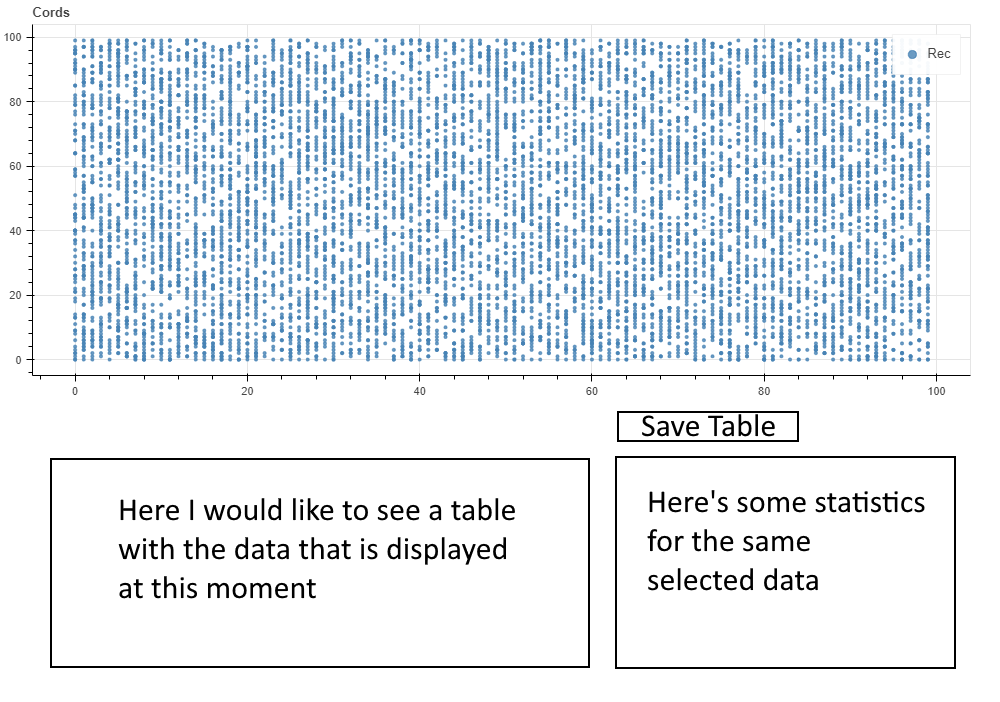
I want to add an option to view a table with data that is currently selected on the screen (for example, using the zoom box but without zooming in - only selection). The Data Table should contain the entire list of coordinates and properties (like 'feature' in the example above) for each point. The second block of information (second table or just text) should contain some statistics, for example, maximum and minimum values, etc.
Below is an example of a code that only plot points.
import pandas as pd
import numpy as np

from bokeh.io import  push_notebook,show,output_notebook
from bokeh.layouts import gridplot
from bokeh.plotting import figure,show,ColumnDataSource
#create data
N=int(10e3)
df = pd.DataFrame(np.random.randint(0,100,size=(N, 2)), columns=list(('x','y')))
df['feature']=np.random.random(N)

TOOLTIPS = [
    ('name', "$name"),
    ("index", "$index"),
    ("(x,y)", "($x, $y)"),
    ("feature", "@feature"),
]
#plot
output_notebook()
p = figure(title="Cords",plot_width=1500, plot_height=700, tooltips=TOOLTIPS)
p.circle('x', 'y', size=3, color="steelblue", alpha=0.8,source=df,name='Rec',legend_label='Rec')
show(p,notebook_handle=True)
I looked for solutions to my problem, but came across solutions for older versions of the library.
I generally could not find an example of building tables that was simple for myself, and in my task I need to show dynamicly selected data in tables and texts.
I also need to be able to save the table with the selected data, for example, save it in a separate df by pressing the “save” button.
Below is some rough diagram of what I want to get. The plot circles is obtained by the code above.