Thank you for the answer, Bryan!
I actually would like to create the grid of pie charts upone the Image object. Something like that:
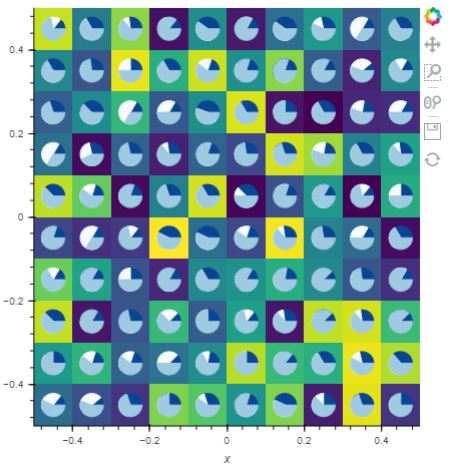
Here is my code:
from bokeh.plotting import figure, show
import holoviews as hv
import numpy as np
import panel as pn
from holoviews.streams import Pipe, Buffer

hv.extension('bokeh')

pipe = Pipe(data=np.random.rand(10,10))
n = 10
def hook(plot, element):
    for i in range(n):
        for j in range(n):
            data = np.random.randint(1,5,size=(3))
            angle = data/data.sum() * 2*np.pi
            plot.state.wedge(x=-.45+i/10, y=-.45+j/10, radius=0.03, start_angle= np.insert(angle[:-1], 0, 0, axis=0),
                                end_angle=np.cumsum(angle), color=['#084594', '#f7fbff', '#9ecae1' ])

_Image = hv.DynamicMap(hv.Image, streams=[pipe]).opts(hooks=[hook], cmap="viridis", xlim=(-.5, .5), ylim=(-.5, .5), width = 500, height=500)
panel  = pn.Row(_Image)
panel
The problem is that it is too slow with a big number of pie charts (more then 100) I guess in my approach I use “separate calls”, maybe you could pitch me an idea for optimizing my implementaiton? Cause I thought it was possible to create a grid of pie charts in one wedge() function