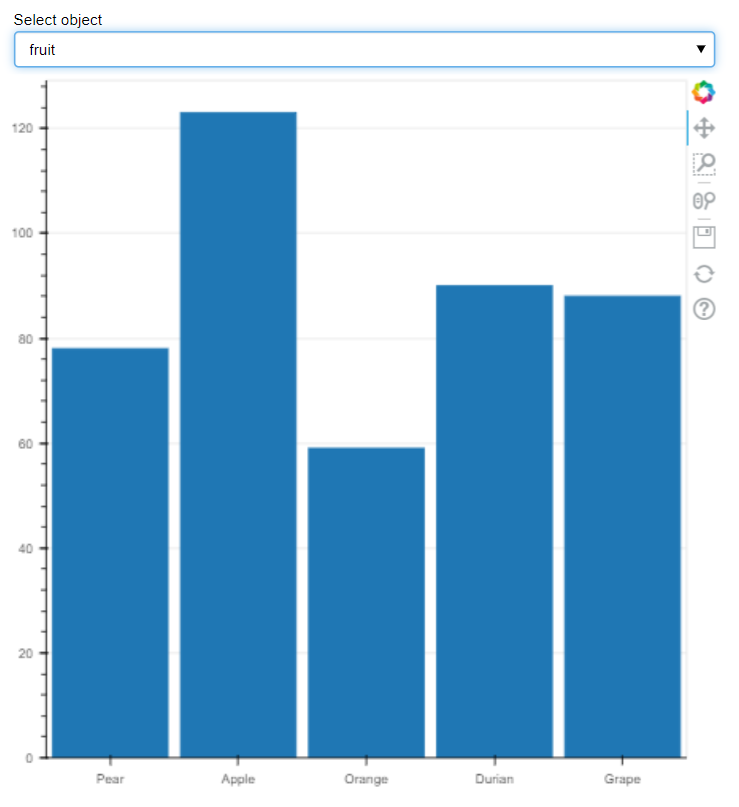
I am working on an interactive bar chart app with the Bokeh server. I want to add an interactive dropdown widget to allow users to select a CSV file from a curated list, and then plot the data from these csv files (fruit CSV file, soda CSV file).
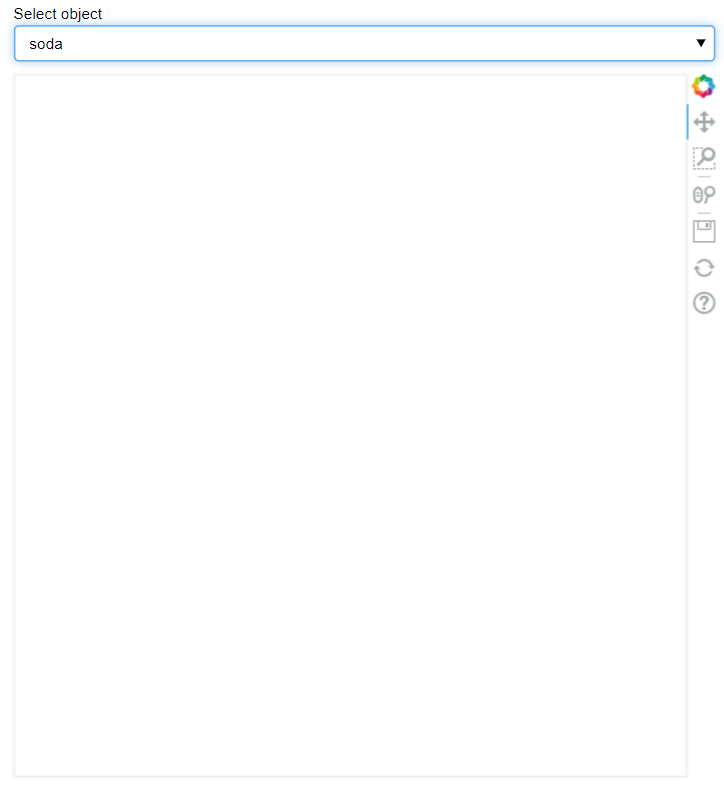
I set the fruit file as my default and it plots as intended. However, when I select the soda file no plot appears. I am concerned that at some point the default glyphs from the “fruit file” are overriding the new glyphs made from the ColumnDataSource with updated “soda file” data. There is no error message displayed to terminal to guide my troubleshooting.
I have confirmed that all ColumnDataSource values update with “soda file” data as expected when I select soda in the dropdown. I have also tried wrapping the glyph plotting into a function and running the function explicitly in the callback. This has given me the same output.
What can I add to see the updated “soda file” plot? Any thoughts are much appreciated!
from bokeh.io import curdoc
from bokeh.plotting import figure
from bokeh.models import ColumnDataSource, Select, FactorRange
from bokeh.layouts import column

import pandas as pd
import numpy as np

df = pd.read_csv('https://docs.google.com/spreadsheets/d/e/2PACX-1vQn0rfV-fDEX5zKWDVmWlOUyqfsNbsiCgYuEAr8LeSX9EwalLCZWT65eTCi_aV_QyMYu0aMj5FJ4b9W/pub?gid=204242863&single=true&output=csv')

source1 = ColumnDataSource()

def create_cds(df):
    df = pd.DataFrame(df.reset_index(drop = True))

    global X, Y, x_list, y_list
    x_list = list(df.columns)[0]
    y_list = list(df.columns)[1]

    X = list(df[x_list])
    Y = list(df[y_list])

    data = {x_list: X, y_list: Y}
    source1 = ColumnDataSource(data = data)

    return source1;

source_input = create_cds(df)
source1.data =dict(source_input.data)

plot = figure(x_range=FactorRange())

plot.vbar(x=x_list, top=y_list, width=0.9, source=source1)
plot.x_range = FactorRange(factors=X)
plot.y_range.start = 0

def callback(attr, old, new):
    if menu.value == 'soda':
        df = pd.read_csv('https://docs.google.com/spreadsheets/d/e/2PACX-1vQn0rfV-fDEX5zKWDVmWlOUyqfsNbsiCgYuEAr8LeSX9EwalLCZWT65eTCi_aV_QyMYu0aMj5FJ4b9W/pub?gid=763506019&single=true&output=csv')
    else:
        df = pd.read_csv('https://docs.google.com/spreadsheets/d/e/2PACX-1vQn0rfV-fDEX5zKWDVmWlOUyqfsNbsiCgYuEAr8LeSX9EwalLCZWT65eTCi_aV_QyMYu0aMj5FJ4b9W/pub?gid=204242863&single=true&output=csv')

    source_input = create_cds(df)
    source1.data= dict(source_input.data)

menu = Select(options=['fruit', 'soda'], value='fruit', title='Select object')
menu.on_change('value', callback)

layout = column(menu, plot)
curdoc().add_root(layout)