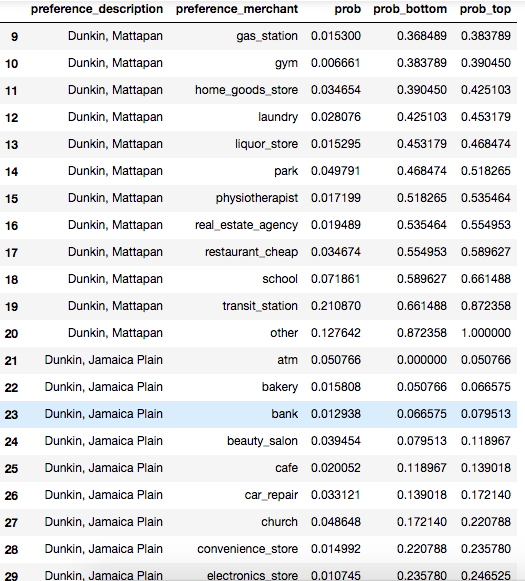
Many thanks! I checked preference_description_unique but there is no any duplicate. The factor is 2-level (preference_description and preference_merchant) but I only passed preference_description_unique to x_range. My goal is to make stacked vbar with tooltips, showing preference_merchant and its probability. I attach data and code below. Thanks!
···
from bokeh.io import show, output_file
from bokeh.models import ColumnDataSource, HoverTool, CDSView, GroupFilter
from bokeh.plotting import figure
from bokeh.palettes import viridis
output_file(‘./images/Preference.html’)
data = {‘prob’: prob,
‘prob_bottom’: prob_bottom,
‘prob_top’: prob_top,
‘preference_description’: preference_description,
‘preference_merchant’: preference_merchant}
source = ColumnDataSource(data=data)
hover = HoverTool(tooltips=[(‘description’,‘@preference_description’),
(‘prob’,‘@prob’),
(‘merchant’,‘@preference_merchant’)])
preference_description_unique = np.unique(preference_description).tolist()
p=figure(x_range=preference_description_unique,tools=[hover])
merchant_list = np.unique(preference_merchant).tolist()
for i, merchant in enumerate(merchant_list):
view = CDSView(source=source, filters=[GroupFilter(column_name=‘preference_merchant’, group=merchant)])
p.vbar(x= ‘preference_description’, bottom = ‘prob_bottom’, top = ‘prob_top’, width=0.9, source = source, view = view, color = viridis(len(merchant_list))[i])
show(p)
Best,
Don
在 2017年9月30日星期六 UTC-4上午10:28:22,Bryan Van de ven写道:
Hi,
That error message is stating that you have not passed a list of unique factors for the x_range. I’m not sure why this is, given the code snippet you have below. It’s not clear from your description what your individual factors look like. Does “preference_description’ associates with 21 ‘preference_merchant’ and their probability values.” mean that the factors are 2-level, i.e. [“merchant”, 0.1] or [“merchant”, 0.4] ? If so, np.unique flattens its inputs, which is probably not what you intend. Otherwise, more information (ideally a reproducing script and data that can be run) is needed to say much more. I can only suggest printing preference_description_unique and verifying that it’s actually what you expect, and that it has no duplicates.
Thanks,
Bryan
On Sep 29, 2017, at 22:29, Don Yang zhenhon...@hotmail.com wrote:
Hi, everyone! I’m a newbie using Bokeh. I had trouble using hover to show value and category together when I used vbar_stacks directly. Then I changed the dataframe(shown as below) and tried to loop vbar with CDSview for filtering category multiple times. But I got “Duplicate factor or subfactor error” in the output. Where did I do it wrong?
My code:
data = {‘prob’: prob,
'prob_bottom': prob_bottom,
'prob_top': prob_top,
'preference_description': preference_description,
'preference_merchant': preference_merchant}
source = ColumnDataSource(data=data)
hover = HoverTool(tooltips=[(‘description’,‘@ preference_description’),
('prob','@prob'),
('merchant','@preference_merchant')])
preference_description_unique = np.unique(preference_description).tolist()
p=figure(x_range= preference_description_unique,tools=[hover])
for i, merchant in enumerate(merchant_list):
view = CDSView(source=source, filters=[GroupFilter(column_name='preference_merchant', group=merchant)])
p.vbar(x= 'preference_description', bottom = 'prob_bottom', top = 'prob_top', width=0.9, source = source, view = view, color = viridis(len(merchant_list))[i])
show(p)
My dataframe: Each ‘preference_description’ associates with 21 ‘preference_merchant’ and their probability values.
Many thanks!
–
You received this message because you are subscribed to the Google Groups “Bokeh Discussion - Public” group.
To unsubscribe from this group and stop receiving emails from it, send an email to bokeh+un...@continuum.io.
To post to this group, send email to bo...@continuum.io.
To view this discussion on the web visit https://groups.google.com/a/continuum.io/d/msgid/bokeh/f69a984e-6c07-4b7a-80ea-8067340fdbd6%40continuum.io.
For more options, visit https://groups.google.com/a/continuum.io/d/optout.