

I’m a developer on a project that uses bokeh in an interactive report. I corrected a crash that was due to a change in v3.4.0, but an element of interactive functionality has stopped working correctly with v3.4.0, but still works on the same data/code with v3.3.4.
You can see an example of our interactive report at: tedana report
If you click on any wedge of the pie chart or dot on the scatter plot, other plots and images appear to the right. When you click on another wedge, the other plots automatically update.
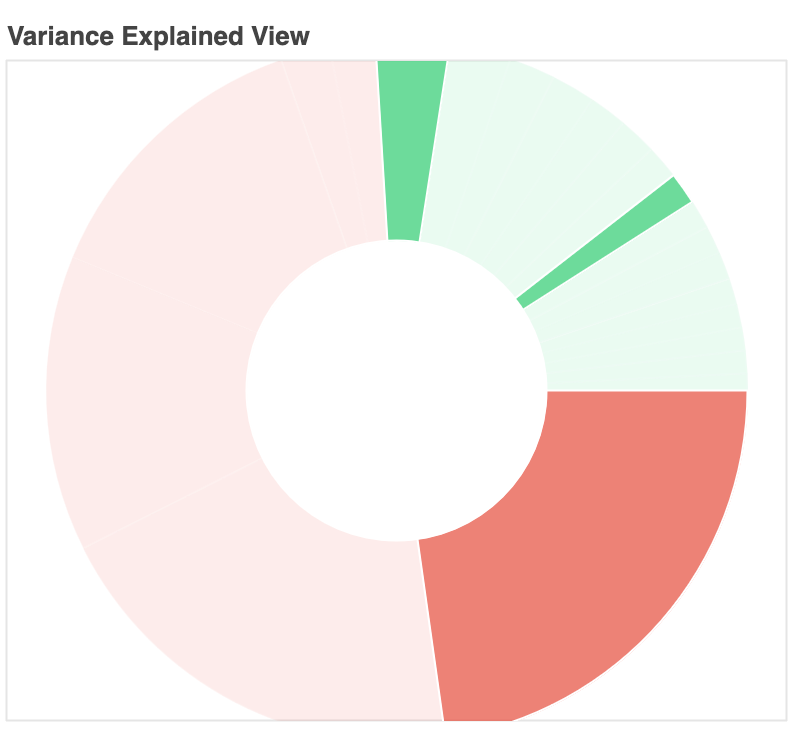
When the same code was run with v3.4.0, I can click on one wedge and the other plots updates, but if I click on additional wedges, multiple wedges are highlighted and the other plots don’t update. I can re-click on wedges so that they are no longer highlighted and the other plots update when there is one and only one wedge highlighted.
Here is an example pie chart with v3.4.0. It should not be possible to have 3 wedges highlighted at the same time.
A PR with the code I’m working on is here: Fix dynamic reports with bokeh 3.4.0 problem by handwerkerd · Pull Request #1068 · ME-ICA/tedana · GitHub
Is there anything specific to the v3.4.0 release that could have affected this functionality?
Thank you for any guidance you can provide.

