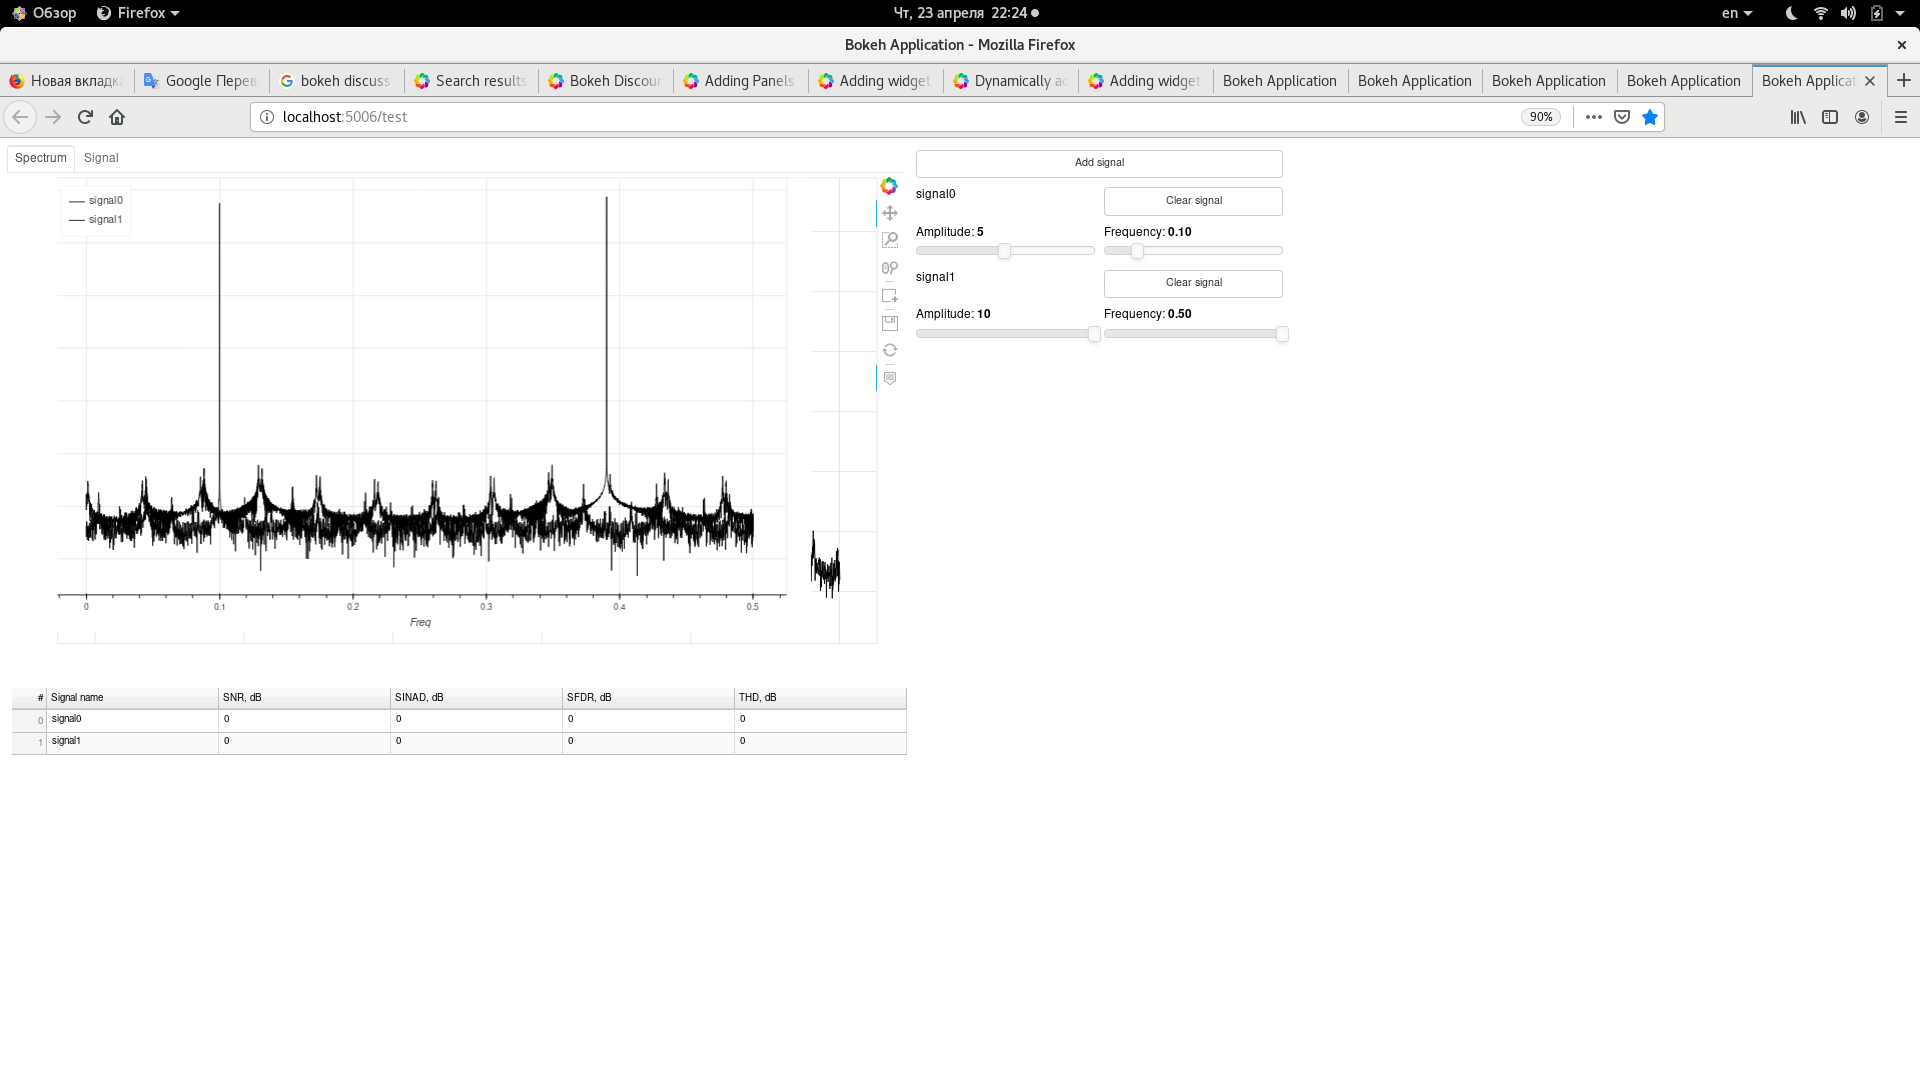
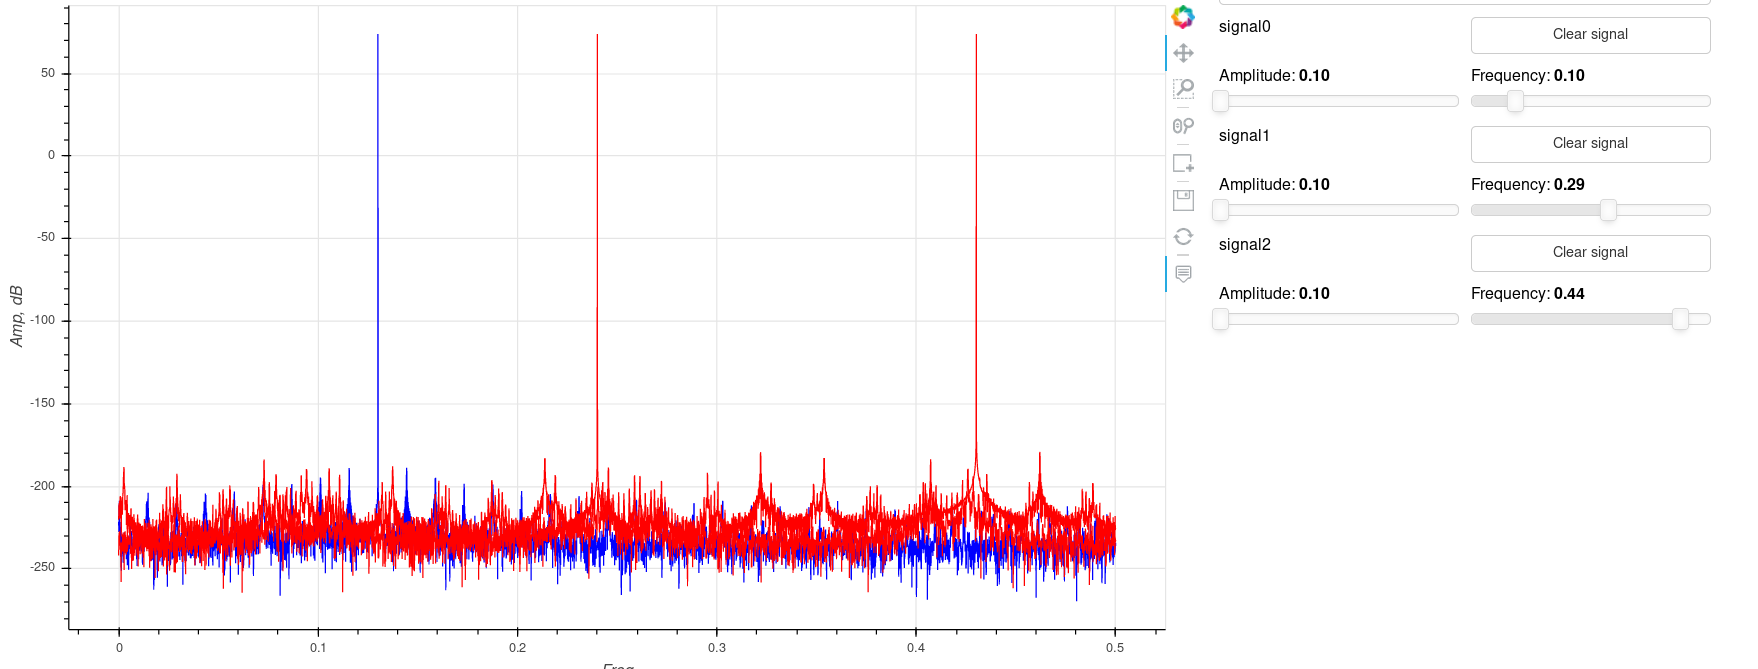
- Dataview
import numpy as np

from bokeh.layouts import column
from bokeh.plotting import figure
from bokeh.models import Panel, Tabs, ColumnDataSource, DataTable, \
                         TableColumn, HoverTool, BoxEditTool

PLOT_WIDTH = 1000
PLOT_HEIGHT = 570

class Dataview:

    def __init__(self):
        self.__signal_figure = None
        self.__spec_figure = None
        self.__table_src = None
        self.__data_table = None
        self.__select_rect_prop = None
        self.__widget = None
        self.__signal_src = {}
        self.__spectrum = {}
        self.__spec_param_names = ('snr', 'sinad', 'sfdr', 'thd')
        self.__create_controls()

    @property
    def widget(self):
        return self.__widget

    def __create_controls(self):
        table_data = {'name':[]}
        table_columns = [TableColumn(field="name", title="Signal name")]
        for par_name in self.__spec_param_names:
            table_data[par_name] = []
            table_columns.append(TableColumn(field=par_name,
                                             title=par_name.upper() + ", dB"))
        self.__table_src = ColumnDataSource(table_data)
        hover = HoverTool(tooltips=[('', "$name"), ('', "($x, $y)")])
        self.__data_table = DataTable(source=self.__table_src, columns=table_columns,
                                      width=PLOT_WIDTH, height=400)
        self.__signal_figure = figure(plot_height=PLOT_HEIGHT, plot_width=PLOT_WIDTH,
                                      tools=[hover, "pan,box_zoom,wheel_zoom,save,reset"],
                                      x_axis_label='Time', y_axis_label='Amp')
        self.__spec_figure = figure(plot_height=PLOT_HEIGHT, plot_width=PLOT_WIDTH,
                                    tools=[hover, "pan,box_zoom,wheel_zoom,save,reset"],
                                    x_axis_label='Freq', y_axis_label='Amp, dB')
        self.__select_rect_prop = ColumnDataSource({'x': [], 'y': [], 'width': [], 'height': []})
        selected_rect = self.__spec_figure.rect(x='x', y='y', width='width', height='height',
                                                source=self.__select_rect_prop, alpha=0.2,
                                                color='green')
        self.__spec_figure.add_tools(BoxEditTool(renderers=[selected_rect],
                                                 custom_tooltip='NSD area'))
        self.__widget = column(Tabs(tabs=[Panel(child=self.__spec_figure, title='Spectrum'),
                                          Panel(child=self.__signal_figure, title='Signal')]),
                               self.__data_table)

    @staticmethod
    def __get_segment_from_rect(rect):
       pass

    def __calc_nsd_selected_rect(self, full_scale):
        pass

    def __update_nsd_table_col(self, *args, **signal_param):
        pass

    def add_signal(self, name, signal, **kwargs):
        self.__signal_src[name] = ColumnDataSource({'x':[], 'y':[]})
        self.__signal_figure.line(x='x', y='y', source=signal,
                                  color=kwargs['color'], name=name, legend_label=name)
        self.__spec_figure.line(x='x', y='y', source=self.__signal_src[name],
                                color=kwargs['color'], name=name, legend_label=name)
        new_table_data = {'name':[name]}
        for par_name in self.__spec_param_names:
            new_table_data[par_name] = [0]
        self.__table_src.stream(new_table_data)
        self.__select_rect_prop.on_change('data', lambda attr, old, new:
                                          self.__update_nsd_table_col(attr, old,
                                                                      new, **kwargs))
        signal.on_change('data', lambda attr, old, new:
                         self.__spec_update(attr, old, new,
                                            name, **kwargs))
        self.__spec_update('data', None, signal.data, name, **kwargs)

    def __update_legend(self):
        self.__signal_figure.legend.location = "top_left"
        self.__signal_figure.legend.click_policy = "hide"

        self.__spec_figure.legend.location = "top_left"
        self.__spec_figure.legend.click_policy = "hide"

    def __update_snr_table(self, row_name, spectrum, **snr_params):
        pass

    def __spec_update(self, attr, old, new, name, **kwargs):
        if len(new['y']) == 0:
            self.__signal_src[name].data = {'x': [], 'y': []}
            spectrum = np.array([])
        else:
            spectrum = np.abs(np.fft.fft(new['y']))
            self.__spectrum[name] = spectrum
            num_of_dots = 1000
            self.__signal_src[name].data = {'x': np.linspace(0, kwargs['fband'], num_of_dots),
                                            'y': 20 * np.log10(spectrum[:num_of_dots])}
        self.__update_nsd_table_col(None, **kwargs)
        self.__update_snr_table(name, spectrum=spectrum, **kwargs)
        self.__update_legend()

    def clear(self, name=None):
        pass
- DemoController:
import random
import numpy as np

from bokeh.plotting import curdoc
from bokeh.layouts import row, column, layout
from bokeh.models import Slider, Button, ColumnDataSource, Div

from dataview import Dataview

WIDTH = 200

class DemoController:

    def __init__(self):
        self.__signal_src = {}
        self.__current_indx = 0
        self.__dataview = None
        self.__widget = None
        self.__spec_param = {}
        self.__create_controls()

    @property
    def widget(self):
        return self.__widget

    def __create_controls(self):
        add_signal_btn = Button(label="Add signal", button_type="default")
        add_signal_btn.on_click(self.__add_btn_handler)
        self.__widget = column(add_signal_btn)

    def connect(self, dataview: Dataview):
        self.__dataview = dataview

    def __generate_signal(self):
        name = f'signal{self.__current_indx}'
        self.__spec_param[name] = {'full_scale':1, 'color': 'red', 'amp':1, 'ftone':.13, 'fband':.5,
                                   'nharm':1, 'well_dc':100, 'well_tone':100, 'well_harm':100}
        self.__spec_param[name]['color'] = random.choice(('blue', 'red', 'black'))
        self.__signal_src[name] = ColumnDataSource({'x': np.arange(10000),
                                                    'y': np.sin(2 * np.pi * \
                                                         self.__spec_param[name]['ftone'] *\
                                                         np.arange(10000))})
        return name

    def __add_btn_handler(self):
        name = self.__generate_signal()
        amp_slider = Slider(start=0.1, end=10, value=0.1, step=.1,
                            name=name +' amp', title="Amplitude", width=WIDTH)
        freq_slider = Slider(start=0.01, end=0.5, value=0.1, step=.01,
                             name=name +' ftone', title="Frequency", width=WIDTH)
        amp_slider.on_change('value', lambda attr, new, old:
                             self.__signal_change(attr, old, new,
                                                  amp_slider.name,
                                                  self.__signal_src[name]))
        freq_slider.on_change('value', lambda attr, new, old:
                              self.__signal_change(attr, old, new,
                                                   freq_slider.name,
                                                   self.__signal_src[name]))
        clear_signal_btn = Button(label="Clear signal", button_type="default", width=WIDTH)
        clear_signal_btn.on_click(self.__clear_btn_handler)

        self.__widget.children.append((column(row(Div(text=name, width=WIDTH), clear_signal_btn),
                                              row(amp_slider, freq_slider))))
        self.__dataview.add_signal(name, self.__signal_src[name], **self.__spec_param[name])

        self.__current_indx += 1

    def __clear_btn_handler(self):
        pass

    def __signal_change(self, attr, old, value, name, signal):
        sig_name, key = name.split()
        self.__spec_param[sig_name][key] = value
        signal.data['y'] = self.__spec_param[sig_name]['amp']*np.sin(2 * np.pi *
                                                             self.__spec_param[sig_name]['ftone'] *
                                                             np.arange(len(signal.data['y'])))
- Dispatcher
from bokeh.layouts import row
from bokeh.plotting import curdoc

class Dispatcher:

    def __init__(self):
        pass

    def draw(self, *args):
        curdoc().add_root(row([item.widget for item in args]))
- Test.
import numpy as np

from bokeh.models import ColumnDataSource

from dataview import Dataview
from dispathcer import Dispatcher
from demo_controller import DemoController

dataview = Dataview()
controller = DemoController()
controller.connect(dataview)
disp = Dispatcher()
disp.draw(dataview, controller)
Save all classes in to one folder. Run test: bokeh serve --show test.py
- Bokeh 2.0.1
- Linux version 4.18.0-147.el8.x86_64 ([email protected]) (gcc version 8.3.1 20190507 (Red Hat 8.3.1-4) (GCC)) #1 SMP Wed Dec 4 21:51:45 UTC 2019