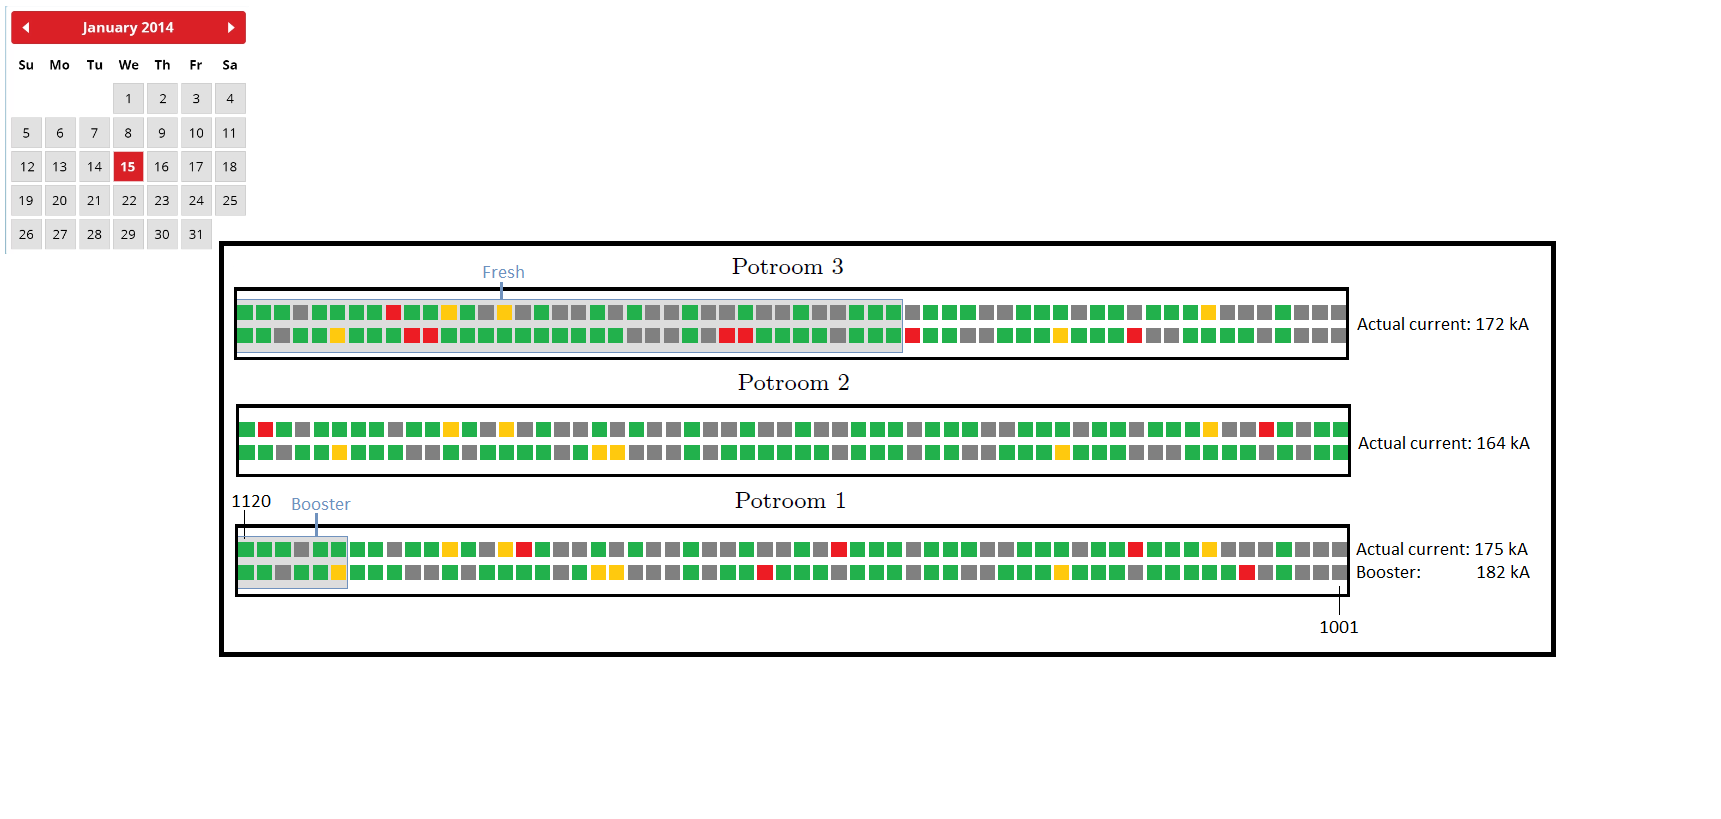
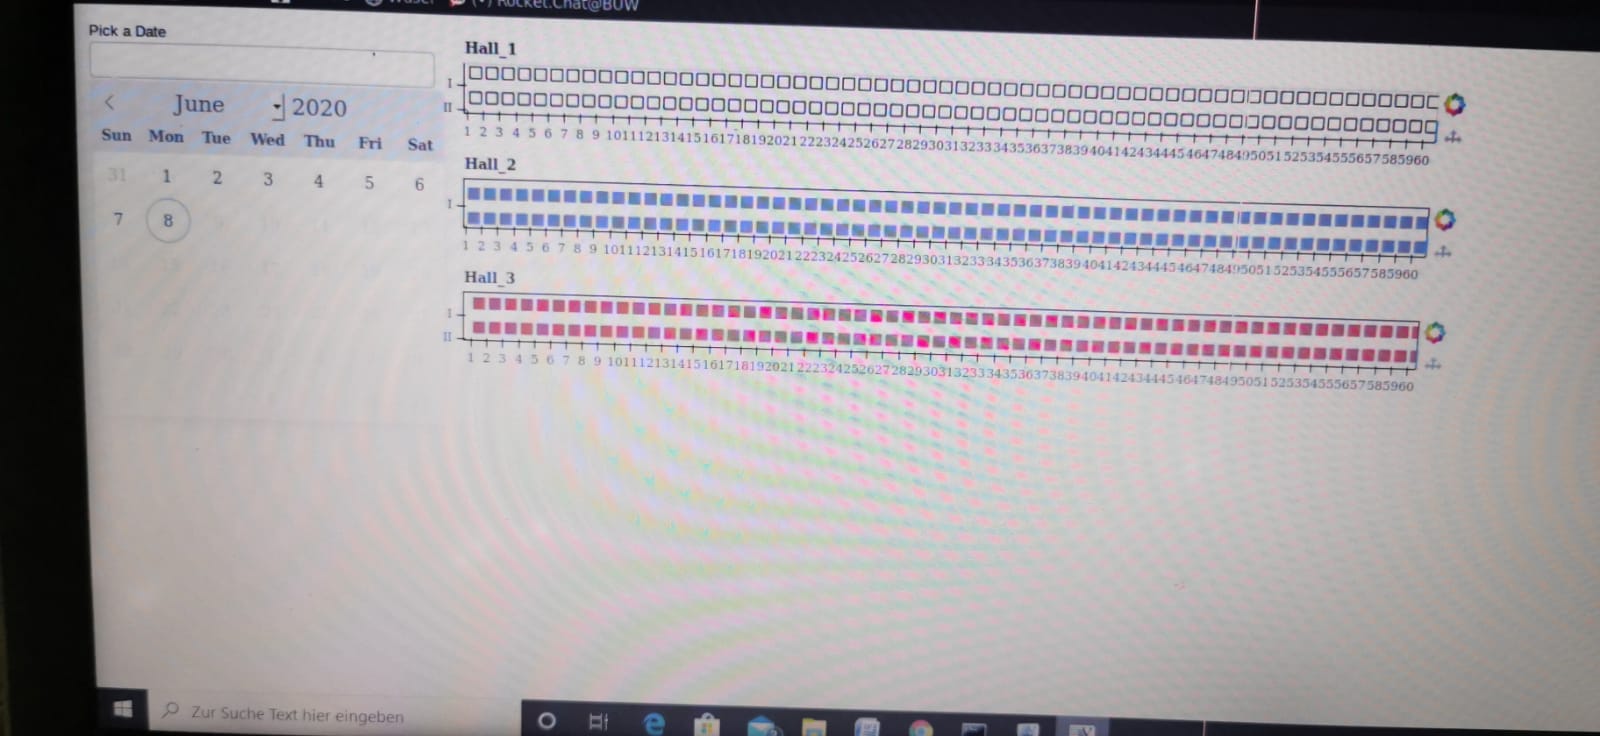
If you arrange your plots via column or some other layout primitive (as opposed to just calling add_root multiple times when you use bokeh serve), then you can specify css_classes for that primitive and write some CSS that would add a border. How exactly that CSS will be used depends on the way you embed the plots. There are multiple examples online.
Regarding the legend - the images don’t have it so it’s hard to say since I have no idea what you want it to look like. Or if you just mean the labels on the right side, then you can combine each plot in a row with a Div with the required text.