☰Read-only archive⌕
Looking for help with Bokeh?

This is a read-only archive. Ask questions and join the conversation on GitHub.

Visit Community Support on GitHub →
Archived discussions · Captured October 28, 2026

Enquiry-Based Learning for Science and Engineering

Showcasereleasewebsiteserver
swamilikes2code
swamilikes2code

Hello everyone,

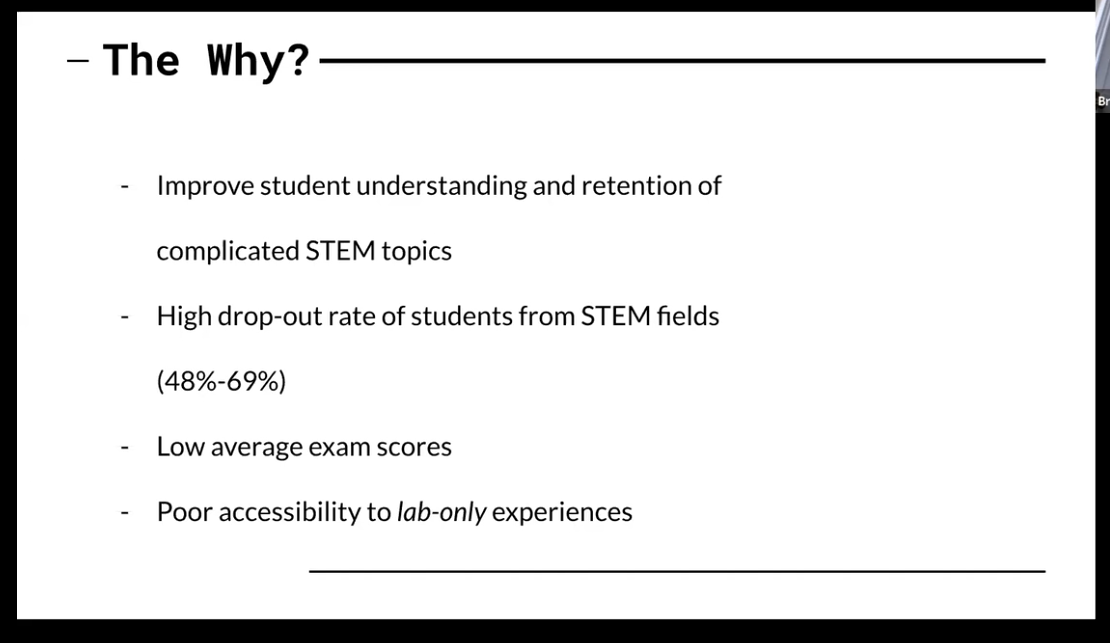
We started this project to encourage enquiry based learning in Science and Engineering education utilizing Bokeh. We got the support of two undergraduates (Anna Moragne and Brian Lucas) to work on this program as part of Mountaintop Program at Lehigh University.

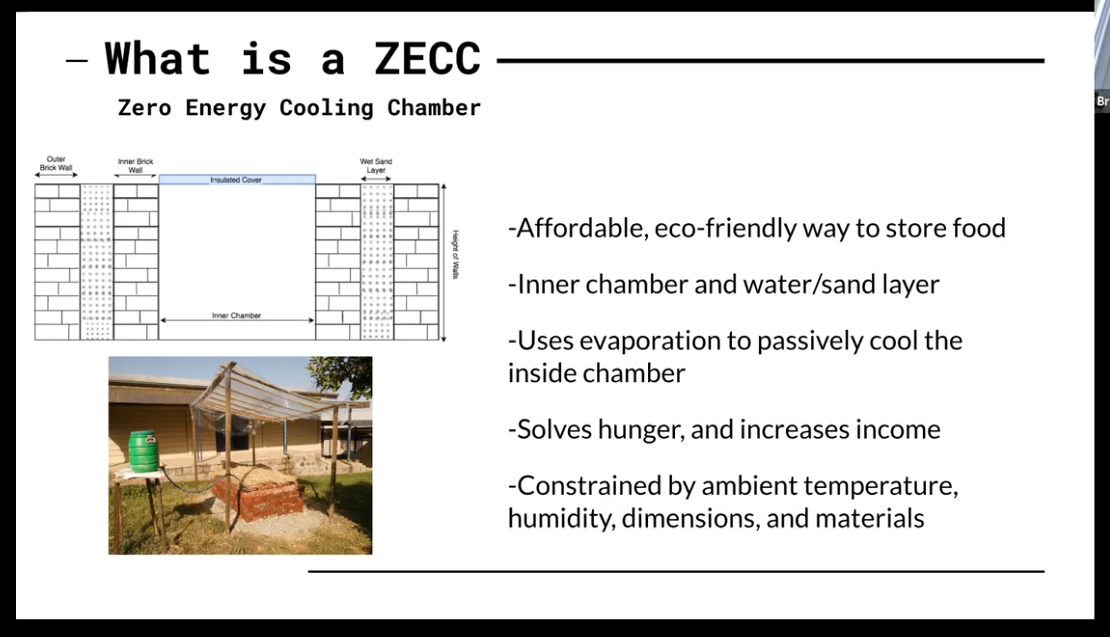
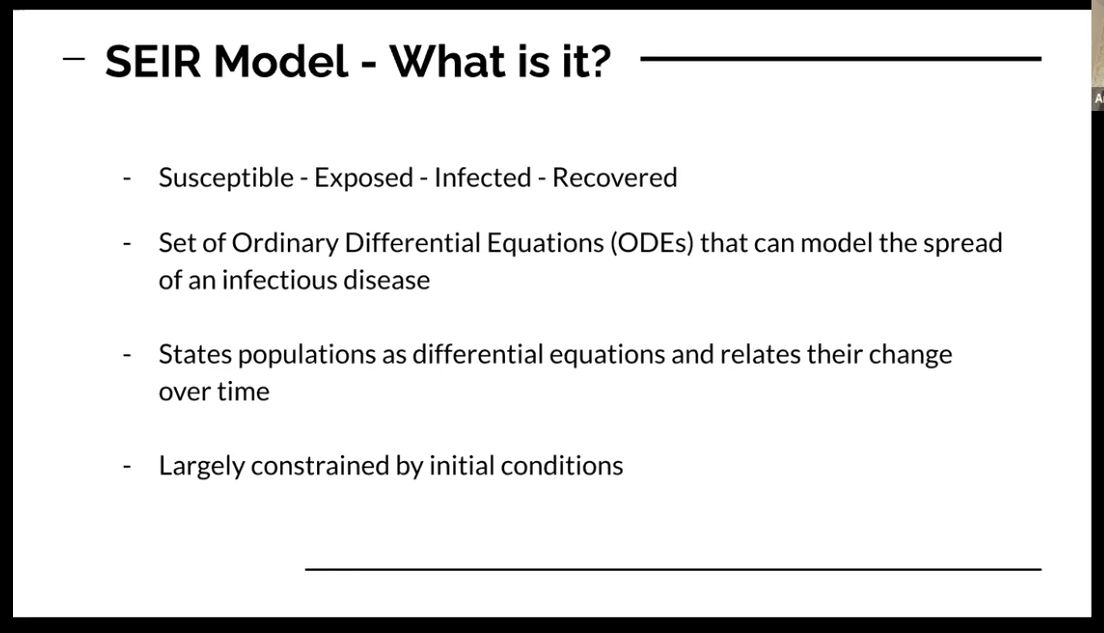
Anna/Brian have come up with an interactive way to describe two science and engineering problems. Zero Energy Cooling Chamber and SEIR (Susceptible-Exposed-Infected-Recovered) disease model, which are planning to be used as part of the curriculum this Fall. We also added a Sequential Reactions for Chemistry/Chemical Engineering. These pages can be accessed below:

Anna/Brian were able to use Sequential Reactions example as a template and utilizing detailed documentation of Bokeh, were able to work independently throughout the project. It is a testament to how well documented Bokeh is.

We received positive feedback from undergraduate students of Science and Engineering at Lehigh. In summary:

The models are easy to understand and the accompanying information was helpful. Most people used their computers to access the website. They thought the homepage design was very easy to use.

We look forward to using these modules for courses this Fall.

⌁   Link to post
carolyn
carolyn

Hi @swamilikes2code,

This is really wonderful. They’re a great mix of classic chart types, interactivity, and then in the infectious disease outbreak model, chart types we don’t see very many of in Bokeh examples (yet!).

We’d like to tweet about these projects if it’s okay with you; if so, is there a Twitter handle we should tag?

Thanks so much for sharing!

⌁   Link to post
swamilikes2code
swamilikes2code

Thank you for the positive feedback and I have shared it with the whole team. Anna worked on the infectious disease outbreak model, setting up the Network Graph Plot working off of Bokeh Documentation.

I am trying to obtain the final presentation made as part of a press conference at Lehigh University. It has a good outline of what we tried to accomplish with demo of each example. Waiting on the recording to be released. The code is open source (GNU General Public License) at this GitHub repo.

Anna/Brian are students who will be looking for opportunities soon. Only myself and Lehigh University have twitter handles. Are LinkedIn handles okay? Since it will be beneficial for them. I requested permission from everyone and they are fine with tagging their LinkedIn/Faculty pages below.

Anna

Brian

Raghu - @raghulikes2code

Srinivas

Lehigh University Program Name which sponsored the project - @LehighU

⌁   Link to post
swamilikes2code
swamilikes2code

Happy to report another update, Srinivas has been awarded a NSF Career award with a portion of the funding going towards developing more tools. We have started working on a prototype already using which students can analyze and build models using datasets interactively via Bokeh. Will share a showcase when we have a more complete version.

Blockquote The research vision of this project is to develop and apply novel computational tools, in synergy with experiments, to design CTH processes by integrating information and decisions across the different size scales. In parallel with this research, the educational vision of this project is to promote computational thinking and programming literacy at various levels of STEM education. These two skills are well-recognized as being essential for the next generation of science and engineering innovators to tackle emerging grand challenges in the energy, health, and environmental spheres.

⌁   Link to post

End of archived discussion · Replies are disabled