@_jm
Thank you for the nice words and good questions.
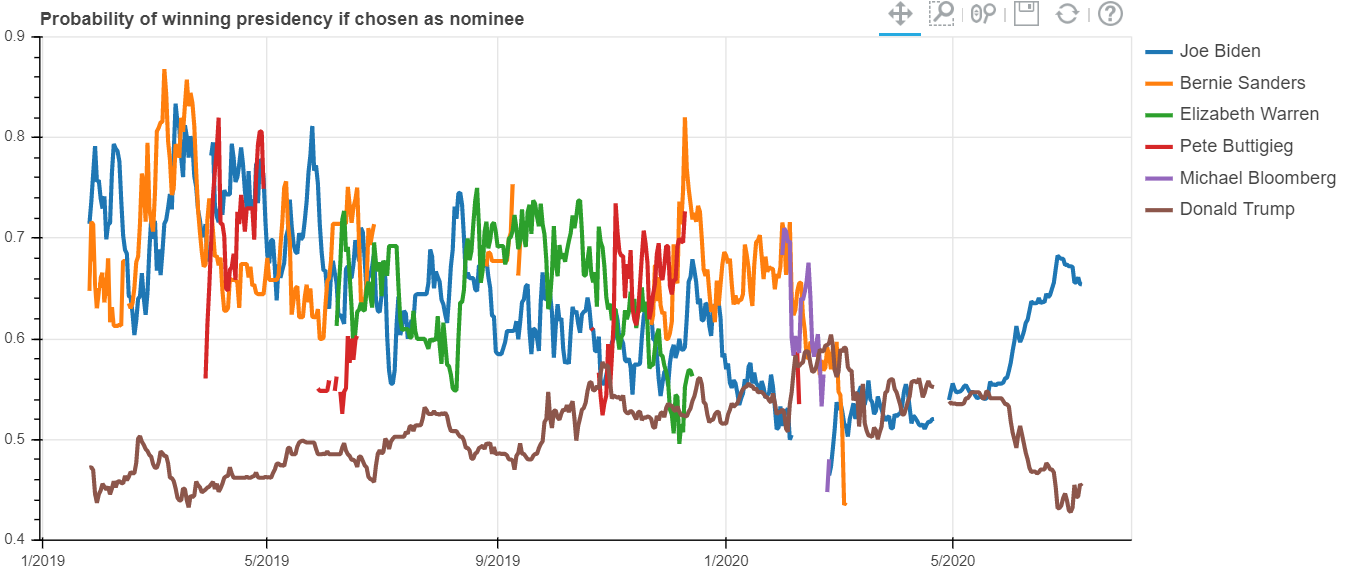
The conditional probabilities on the lower chart won’t sum to 1 because they correspond to different states of the world (a state where Bernie wins the nomination, a state where Biden wins, etc). As a thought experiment, assume for simplicity that Trump is definitely going to be the GOP nominee, that he is wildly unpopular, and that any Democratic candidate would definitely beat him. Then all the Democratic candidates’ conditional probabilities would be 1 because their probability to win the nomination would equal their probability to win the general election.
The post-May numbers are a little harder to explain but I’ll make a guess. Currently the presidential election betting market is saying Biden has a 60% chance to win in November and Trump has a 40% chance (you can see this market on predictit website). This means the conditional probabilities will only sum to 1 if each candidate has a 100% chance of winning their nomination, but in fact the nomination markets are saying that both have about a 90% chance. It seems that the presidential election market is ignoring the low-probability events that one or both men don’t actually get their party’s nomination.
I think the 538 models do take this betting market data into account, but they also use a lot of polling data and have different weighting schemes depending on the quality and size of the polls etc.
Hope this helps!