Hello all,
I wanted to make consistant background look of my charts and found that Im not able to make it.
Figure has few basic tools:
- Backgroud
- Outline
- Border
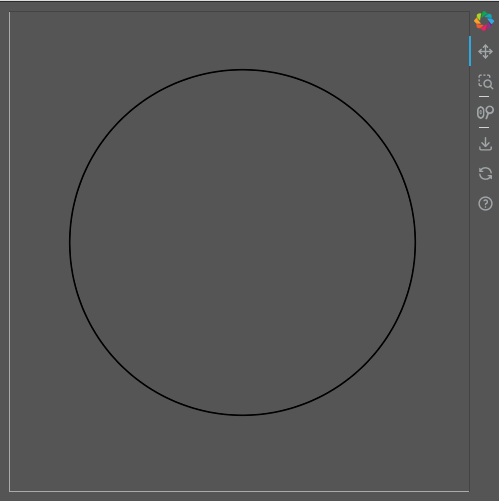
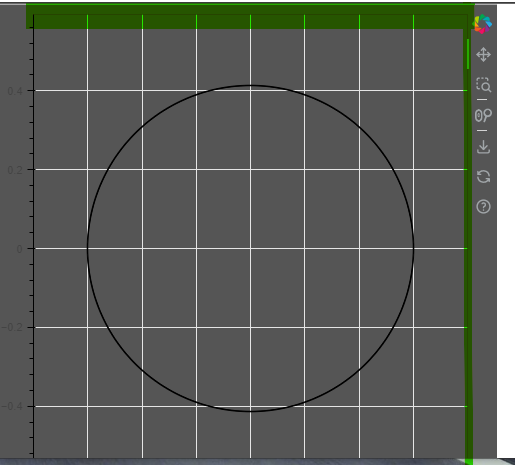
- is there something I miss? → I cannot get rid of the line(marked by green in example)
If I use Background.alpha, and Outline.alpha charts has not same look for
how to make “Outline” share same paramets as background not to look different?
Simplified example:
from bokeh.plotting import figure, show
from math import pi, sin, cos

plot = figure(title=None, width=500, height=500, x_range = [-4,4], match_aspect=True)

# BackGround Colors
plot.background_fill_color = "#2A2A2A"
plot.background_fill_alpha = 0.8

# Outline
plot.outline_line_color = "#2A2A2A"
plot.outline_line_alpha = 0
plot.outline_line_width = 1

# Borders
plot.border_fill_color = "#2A2A2A"
plot.border_fill_alpha = 0.8
plot.min_border_left = 10
plot.min_border_right = 10
plot.min_border_top = 10
plot.min_border_bottom = 10


# Main circle
plot.annular_wedge(
    x = 0,
    y = 0,
    inner_radius = 3,
    outer_radius = 3.01,
    direction = "anticlock",
    start_angle = 0,
    start_angle_units = "rad",    # "deg", "rad", "grad" and "turn".
    end_angle = 2 * pi,
    end_angle_units = "rad",      # "deg", "rad", "grad" and "turn".
    line_color = "black",
    fill_color = "black")


show(plot)