☰Read-only archive⌕
Looking for help with Bokeh?

This is a read-only archive. Ask questions and join the conversation on GitHub.

Visit Community Support on GitHub →
Archived discussions · Captured October 28, 2026

Fill between multi_line

Community Support
odadoun
odadoun

Hi,

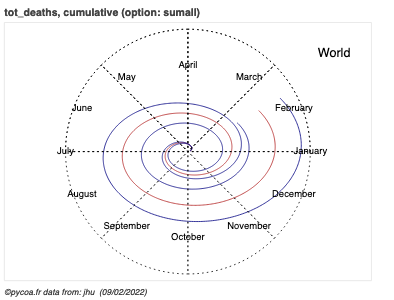
to produce my spiral char I use Mutiline

 multi_line([x_base,x_cas_sup,x_cas_inf],[y_base,y_cas_sup,y_cas_inf],color=["firebrick", "navy","navy"])
image
Now I would to colorize between my multiline, I am looking for the analog of fill_between from Matplotlib.
Any idea ?
By advance thank you
cheers,
Olivier

⌁   Link to post
gmerritt123
gmerritt123

I wrote a routine to do this on the JS side for my XS tool (Aqua Insight Inc. - Hydrographs) by stitching together a series of patch geometries based on the coords of each array of line coords and the array of line coords below it (so iterating through the length of the multiline source - 1). You just have to ensure your multiline source is ordered the way you want beforehand.

Pythony pseudo code wise, it’s along the lines of:

patch_geoms = {'xs':[],'ys':[]}

for i in range(len(multiline_src.data['xs'])-1):
    #get the upper line coords
    upperX = multiline_src.data['xs'][i]
    upperY = multiline_src.data['xs'][i]
    #get the lower line coords
    lowerX = multiline_src.data['xs'][i+1]
    lowerY = multiline_src.data['xs'][i+1]
    #x geom for the patch will be the upperX + the lowerX reversed (kinda stitching together "clockwise)
    geomX = upperX+lower[X][::-1]
    #same idea for y geom
    geomY = upperY+lower[Y][::-1]
    #add this to patch geoms
    patch_geoms['xs'].append(geomX)
    patch_geoms['ys'].append(geomY)

Then pass those patch geoms to a Patches glyph.

⌁   Link to post
odadoun
odadoun

@gmerritt123
thanks for you solution it helps me a lot ! :pray:
Here my minimal solution

        standardfig.multi_line([x_base,x_cas_sup,x_cas_inf],[y_base,y_cas_sup,y_cas_inf],color=["firebrick", "navy","navy"])
        xcol,ycol=[],[]
        [ xcol.append([i,j]) for i,j in zip(x_cas_inf,x_cas_sup)]
        [ ycol.append([i,j]) for i,j in zip(y_cas_inf,y_cas_sup)]
        standardfig.patches(xcol,ycol,color='blue',fill_alpha = 0.5)


By the way Aqua web site is very nice :muscle:
cheers
olivier

⌁   Link to post

End of archived discussion · Replies are disabled