Finding available events and properties?

I see all the js_on_event and js_on_change functions to add event and property change callbacks to parts of my plots, but I don’t see anywhere the list of valid strings to pass to said functions.

Are there lists anywhere? I feel like I’m stumbling in the dark here.

Right now: I have a tap tool that’s changing a line. Is that an event or a change on that line? and what is that event or property name?

But, it’s not really just lines – why can’t I figure this out for literally anything unless I google for sample code with the string in it? Surely this is documented somehow?

All events: bokeh.events — Bokeh 2.4.2 Documentation

Regarding the on_change and js_on_change functions - the callbacks are triggered when the corresponding property’s value is changed, that’s it. The properties are listed in the documentation for each specific model.

With that being said, there are some intricacies. Like events don’t work with every model - e.g. events are not triggered for annotations. And with properties - a callback should always trigger if you assign to a property. But if you change the property in-place, it may not be triggered.

Explain it like I’m a completely frustrated beginner… Like, where are these “some intricacies” actually documented? And is there any documentation about what the properties are anywhere? Does some property on my Line change when it’s changed from selected to non-selected or vice versa?

Bokeh has changed the appearance of my line, so I can tell it was successfully selected, but how to I get that information to my own code?

I managed to try “all the properties” by doing

for p in line.properties():
    line.js_on_change...

And I seemed to verify that no properties change on my line in response to the Tap tool selecting it.

I can’t find a way to register for “all the events” – I get errors when trying to register for Event, DocumentEvent, PlotEvent.

I’m guessing at this point that there is no event at all when a line is selected? Could that be right?

where are these “some intricacies” actually documented?

I don’t think there’s a single place where they all are mentioned. I could be wrong though.
But that information is definitely there, if a bit scattered throughout the examples.

is there any documentation about what the properties are anywhere?

As I said - every model has its own set of properties (which are just regular Python attributes wrapped in Bokeh-specific stuff). They’re documented on the docs page of that specific model. For example, for the Line model: Line — Bokeh 3.3.2 Documentation

Does some property on my Line change when it’s changed from selected to non-selected or vice versa?

Selection is driven by the corresponding data source. Some description of what’s going on is here and here. Maybe some place else, those two are just the first that I found.

I can’t find a way to register for “all the events”

I don’t think there’s such a way without just iterating over all possible concrete events.

I’m guessing at this point that there is no event at all when a line is selected? Could that be right?

As described above, it’s about the data source, not about the line. In this case, the event would be change of the property indices of data_source.selected. So, you can just use js_on_change instead of js_on_event:

With that being said, I’m not sure if lines can be selected at all with the built-in Bokeh mechanisms, given the line_select.py example. You say “I have a tap tool that’s changing a line” but I have no idea what actually is going on without the code. Maybe you’re doing something that’s completely unrelated to events or properties.

1 Like

With that being said, I’m not sure if lines can be selected at all with the built-in Bokeh mechanisms

Besides the (old-style) Taptool callback in that example, Selection.line_indicies are set when a point or span hit-test is registered.

@jcarson js_on_change is a generic mechanism to watch for any change on any typed Bokeh property on any Bokeh model. All Bokeh model properties are automatically documented (type, default, helpstring) in the bokeh.models Reference Guide. The Python and JS sides have identical sets of properties, maintained under test, so the Python reference guide is also the JS reference guide in this regard.

As for events, the current reference guide lists all the events themselves, but is a bit vague on where they can be applied. However there is a lot of “by demonstration” docs in the examples directory of the repo. Here is an example that shows every event being used:

https://github.com/bokeh/bokeh/blob/branch-2.3/examples/howto/js_events.py

As you can see, with the exception of button clicks (and in the Bokeh server case, a very new “init” event), all events are currently registered only on plots. This uniformity is probably how explicit mention got overlooked in documentation, but it would be better if this was made explicit. The string aliases are documented on the class definitions for the events:

https://github.com/bokeh/bokeh/blob/branch-2.3/bokeh/events.py#L183

Again, the docs automation could be updated to pull these aliases in to the bokeh.events module page automatically. Please feel free to open a Github Issue to suggest any improvements.

2 Likes

@Bryan - I’m finding the documentation really frustrating to work with. It seems like no matter what page you’re looking at, it all looks the same boilerplate.

That example doesn’t show me anything with a Line in it, either.
Backing up from where I was, I want to be able to select a line from a plot with other lines. I tried making my plot without any callbacks, just to make the user interface part work, then I could get the selected part and “do things” with it later.

It seems like selecting a line only worked with the Tap tool and not the BoxSelect one? Is that right? The plot didn’t change at all in response to the BoxSelect tool, but my callback fired. Is there a way to tell the line to switch to the selected verus default appearance parameters from the BoxSelect callback?

I will try working with the Selection.line_indices and see what happens and post my source code when I get stuck again.

OK, It took me a bit to find the Selection thingy, but I got the tap tool to work. Any idea why no line_indices change message when I play with the BoxSelect instead?

import random

from bokeh.io import output_notebook, show
from bokeh.plotting import figure
from bokeh.models import Line, CustomJS
from bokeh.events import SelectionGeometry
from bokeh.models.tools import BoxSelectTool, TapTool

from palettable.cartocolors.qualitative import Bold_8

output_notebook()

# create a new plot (with a title) using figure
plot = figure(plot_width=500, 
              plot_height=300, 
             )

x = list(range(10))

change_script = """
    console.log("change called ", whichprop, whichline);
    // if cb_obj.line_indices.length == 0, whichline's been untapped
    // if cb_obj.line_indices.length == 1, whichline's been selected
    console.log(cb_obj.line_indices.length)
"""

lines = []
# add a line renderer
for index, color in enumerate(Bold_8.hex_colors[:4]):
    y = [ index * 5 + random.choice(x) for i in range(10) ] 
    name = f"line{index}"
    line = plot.line(x, y, line_width=2,  color = color,  name = name)
    line.selection_glyph = Line(line_color='black', line_width=3)
    line.data_source.selected.js_on_change(
        'line_indices',
        CustomJS( code = change_script,
                  args = dict( whichprop = 'line_indices', whichline = name
                )
            )
        )
        
select_script = """
    console.log("select called")
    console.log(cb_obj)
    console.log(cb_data)
"""
select_callback = CustomJS(code=select_script)

box_select =  BoxSelectTool()
tap_tool =  TapTool()
plot.add_tools(tap_tool, box_select)

plot.js_on_event(SelectionGeometry, select_callback)
show(plot);

Any idea why no line_indices change message when I play with the BoxSelect instead?

As I mentioned above, line gyphs currently only support hit testing against points and spans (i.e. not boxes):

Selection.line_indicies are set when a point or span hit-test is registered.

Someone could implement a _hit_rect method on Line in BokehJS and then lines would immediately support Box selections. The reason it has not been done yet is that there is more than one reasonable way to do hit-testing of lines with boxes (is it equivalent to selecting any point on the line? Or do individual segment-box intersections count? Other possibilities?) Any time there is a multiplicity of policy options my strong inclination is to have some notion of consensus about the best course of action, rather that just implementing what ever my personal whim is. So far no one has ever offered strong opinions about this particular question. In fact from ~8 years of answering Bokeh support questions, I gather that caring about selections with lines is actually very uncommon, which is one reason there is not much effort spent on documenting it in particular. There’s only so many person-hours in the day.

That example doesn’t show me anything with a Line in it, either.

Right, sorry if I was not clear on this point: That example essentially demonstrates the sum total of all things that can be done with events. It does not show anything with lines, because nothing with events applies to lines. I was trying to answer the question “where can I find all available events”, and the answer is: that one single example, it has everything that is possible to do with events.

I’m finding the documentation really frustrating to work with. It seems like no matter what page you’re looking at, it all looks the same boilerplate.

That’s fairly typical of reference documentation, I think? Reference docs are usually most useful to someone who is already fairly familiar with something, and needs to look up some specific detail about something they already know something about.

I am sorry you are finding the docs frustrating. To the extent that the majority of them were created by me, that falls on me. I created a docs architecture that address my own POV about what constitutes good docs: lots of examples (Bokeh docs have hundreds of live examples with full code and there are even more in the GitHub repo), a Gallery (for quick visual indexing), live tutorial notebooks (for immediate exploration), a big User Guide (for narrative, story-telling docs), and a reference guide (that is automated in order to be complete). But therefore one problem is that by my standards, and in comparison to the many docs sites I’ve seen and had to use in 20+ years of OSS usage, the Bokeh docs are superlative—to me. Which doesn’t mean that they are for everyone, of course. But I’ve created the best docs that I know to, and things will not change appreciably until/unless new folks decide to contribute work that reflects their own (different) POVs in a substantial ways. Such is the nature of open source development.

1 Like

Also, re: what glyphs support what kind of selections. There is a current census of hit-testing support in the Wiki:

Glyph Hit Testing Census · bokeh/bokeh Wiki · GitHub

It would be a really great “first issue” if anyone wanted to take on the task of translating that raw information in to the actual docs site.

I’m slowly wrapping my way around the lingo, I guess, selections are really bad when searching the docs. The select() method has nothing to do with the selecting tools. The object is called Selection, but the property is called selected…Oy!

I don’t understand what “Hit testing” means?

I tried just setting the line_indices myself (my basic callback just ignores the box and just selects line 0 – My change callback gets called, just like when I was using the tap tool, but the line never changes to the “selection_glyph”

plot = figure(plot_width=500, 
              plot_height=300, 
             )

change_script = """
    console.log("change called ", whichline, cb_obj)
    if (cb_obj.line_indices.length == 0) {
        console.log("unselect line")
    } else {
        console.log("select line")
    }
"""

# add a line renderer
lines=[]
for column, color in zip(line_df, Bold_8.hex_colors[:4]):
    line = plot.line(line_df.index, line_df[column], line_width=2,  color = color,  name = column)
    line.selection_glyph = Line(line_color='black', line_width=3)
    lines.append(line)
 
for index, line in enumerate(lines):
    line.data_source.selected.js_on_change(
        'line_indices', CustomJS( code = change_script, 
                                  args = dict( whichline = line_df.columns[index])
                                )
        )
        
        
select_script = """
// For now, no matter where box was, just select line 0
    console.log("select called");
    source.selected.line_indices = [8];
    source.change.emit();
"""
select_callback = CustomJS(code=select_script,
                          args = dict(source = lines[0].data_source),
                  )

box_select =  BoxSelectTool()
plot.add_tools(box_select)

plot.js_on_event(SelectionGeometry, select_callback)
show(plot);

Overloading of terms is a common and often-discussed situation for software in general. The select method is for selecting objects out of the Bokeh document object-graph. The selected property records UX selections on plots. They both, for better or worse, relate to “selections”, just in different contexts. :man_shrugging:

I don’t understand what “Hit testing” means?

Hit-testing is a check for geometric intersection:

  • Does a single point (e.g. coordinate of a mouse tap) intersect with any vbar glyphs?
  • Does a rectangle (e.g. drawn by a box-select tool) intersect with any scatter plot markers?
  • Does a polygon (e.g. drawn by a lasso-select tool) intersect with patches glyphs?

Etc. And if there is an intersection, what are the indices of the specific things that were “hit”? As a concrete example: If I draw 200 circles and tap-tool click on the 117th one, then the selection is the list [117]. If I lasso tool draw around thirty scatter points, then the selection is a list with those thirty indices.

Now, not all glyphs support every kind of hit testing. That might be because it doesn’t make sense at all for some combinations, or because there is just not enough interest to justify the effort, or as I mentioned above, because there are open questions about the best approach. Lines currently only support “point” hit testing (“tap tool”) and “span” hit testing (there is no span selection tool, but hover tools can be configured with a “vline” or “hline” mode that uses span hit-testing).

However, finally, and importantly for you: Lines are special and different. Almost all bokeh glyphs, e.g. scatter markers, bars, patches, etc. are all “vectorized”. You supply a table of 200 data coordinates and you get 200 circles drawn, and each of those can be selected individually or in groups. But line glyphs are not like that at all, in a very fundamental way. A line has a connected topology. You give 200 data coordinates, but only have one single line as a result. That means line selections don’t (can’t) fit neatly in the scheme I described above.

When a tap tool “hits” a line, regardless of which point, it has to record that the entire line glyph as a whole is selected. However, it also reports the nearest points in the line in line_indices. It does this because this is often useful information to report to callbacks. But for lines specifically, setting line_indices is not sufficient to programmatically trigger a visual selection “on the entire line”. When you set line_indices = [0] that does not mean select the “first line”. When a given Line glyph renders, there is just the one line, so line_indices = [0] means the first point of that one line. That is not what will cause a “visual” selected appearance for an entire line.

FWIW, I was also specific and careful about this in my wording above:

Selection.line_indicies are set when a point or span hit-test is registered.

i.e., it works in one direction (UX selection on a line → Bokeh sets line_indices for you), but not in the opposite direction. Instead you would need to set the selected.selected_glyph property to be the line glyph model. That is what indicates that the “entire line” is selected, as can be seen in the actual code that checks for this:

Selecting lines programmatically is not really documented anywhere because:

  • it is unavoidably complicated and in the weeds compared to most glyphs, and
  • without any exaggeration, you are the very first person to ever ask about it

In any case, to programatically cause an entire line to display as “visually selected”, the callback should look something like this (untested):


line = plot.line(...)

cb = CustomJS(args=dict(glyph=line.glyph, source=line.data_source), code="""
    source.selected.selected_glyph = glyph
""")
As an aside, the question of whether to explicitly expose the concept of point topology is an interesting one. There are certainly tools that do. One example is the venerable VTK library for 3d visualization. You supply a geometry, which is just a list of points with no intrinsic relationships. Completely separately, you supply a topology for the points—are they isolated? Connected in line(s)? Part of a triangle mesh? Probably more widely known, this is also how things work in OpenGL / WebGL.

But I think this explicit distinction is mostly confined to “3d” tools. Plotting/charting libraries by and large tend to hide the topological considerations implicitly behind function names, e.g a “scatter” is a bunch of disconnected polnts, a “line” is a bunch of points joined in sequence. Hiding all this probably make things “simpler” for users in most common situations (right up until it doesn’t, like now).

@Bryan - The “whichline” was just passed to console.log print statement in the first version of the code. It worked fine and wasn’t used for anything else.

I’m a beginner at this – the “standard” Bokeh model is still new to me, and the “it works for everything but lines” is more confusing.

The code snippet with LineView is over my head, and LineView doesn’t come up in the documentation search box.

I tried your callback as follows:

select_script = """
    // For now, no matter where box was, just select line 0
    console.log("select called");
    source.selected.selected_glyph = line.selection_glyph
"""
select_callback = CustomJS(code=select_script,
                      args = dict(source = lines[0].data_source, line = lines[0]),
              )

box_select =  BoxSelectTool()
plot.add_tools(box_select)

the error was:

TypeError: setting getter-only property "selected_glyph"

I don’t disagree, but my point is that this difference is unavoidable because lines are fundamentally different from scatters.

TypeError: setting getter-only property “selected_glyph”

It looks like I was too hasty. As the error states, it turns out that selected_glyph is actually a read-only derived property. Digging further, I find that the Line glyph view is what must be set on the selection to indicate a “whole” line was selected. But views are not public, user-visible things. TLDR; at this point, I have to conclude programmatically setting a whole line to be selected is possible in any simple way. The next step would be to create a GitHub issue to request that this capability be added.

So, from my perspective, the idea that there is “one true way” to handle selections on a line is probably the wrong way to think about the problem – if there are so many different ideas for how they “should” work means that different users have different use cases.

Are there other packages out there I should look at for adding a plot with user controls to a python/flask app?

@jcarson I feel I must not be communicating effectively because “too many use cases” was the opposite of what I meant to convey. You are literally first and only person to ask about programmatically selecting lines (or box selection on lines) in eight years. That is why none of this has received any attention (and why I suggest a GitHub issue expressing and recording interest in this as the first step towards trying to prioritize work being done).

I don’t have any especially valuable information or opinions to share about other tools.

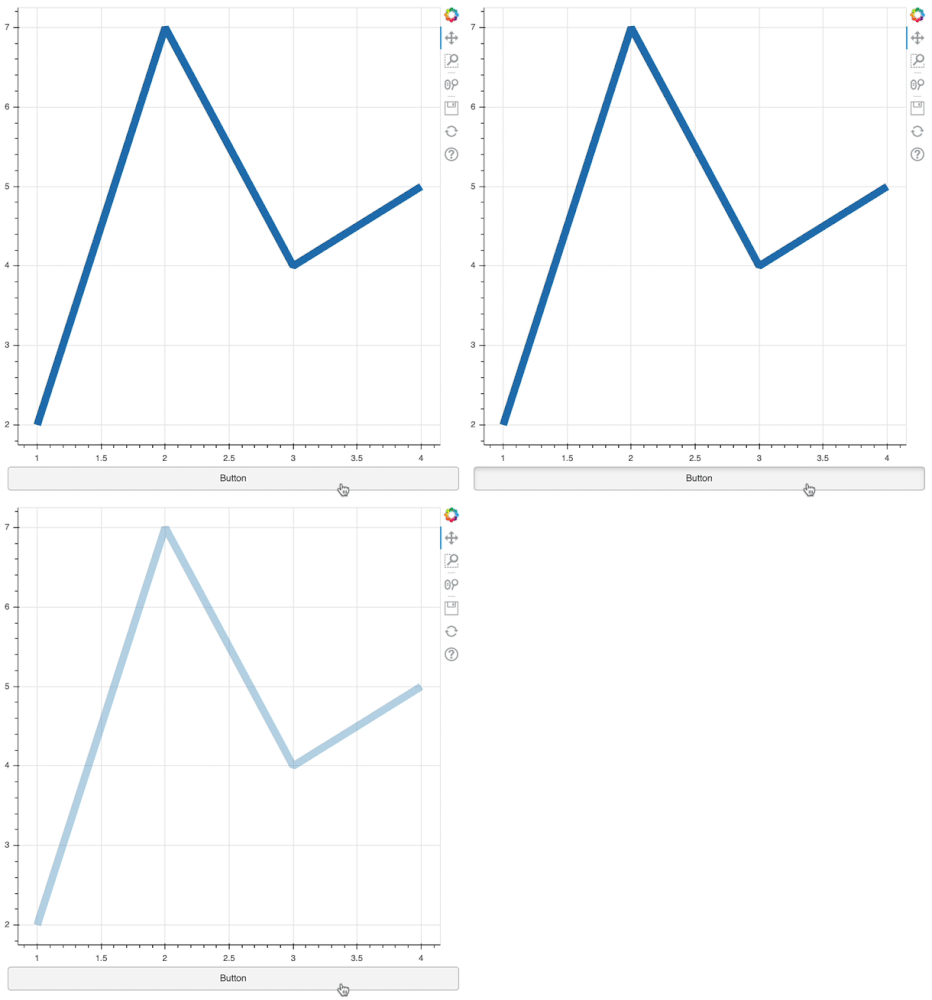
However, one last possibility occurred to me. There is also a multi_line_ glyph. This glyph is vectorized like a scatter, i.e. a scatter plot of lines. It takes a vector of line coordinates (i.e. a list of lists) as data and draws multiple lines. Using this, source.selected.indices = [0] does mean “select the first line”. The tradeoff is that your data preparation is a little more complicated. In any case, here is a complete working example (that uses a button for simlicity):

from bokeh.layouts import column
from bokeh.models import Button, CustomJS
from bokeh.plotting import figure, show

p = figure()

# each element of xs and ys is a sublist (for one line)
r = p.multi_line(xs=[[1,2,3,4]], ys=[[2,7,4,5]], 
                 line_width=10, selection_alpha=0.3)

b = Button()
b.js_on_click(CustomJS(args=dict(source=r.data_source), code="""
    source.selected.indices = [0]
"""))

show(column(p, b)

This is really helpful!

Sorry I got so frustrated.

The BoxSelect tool isn’t really doing anything in my example – I just basically need a way to be able to change a line from the “plain” appearance to it’s “selected” one. Whatever callback or event or property change does that is “just code.” And, hearing that making that change is “protected” from me was really making me feel hopeless for accomplishing the tasks that I’m trying to do outside this “toy” example.

If the multiline select can be controlled programmatically, and the line can’t be, I don’t have any problem with putting in the extra set of brackets when I set up the data! Thank you!

1 Like