Hello all
I managed to write a plot where I can dynamically set a span.
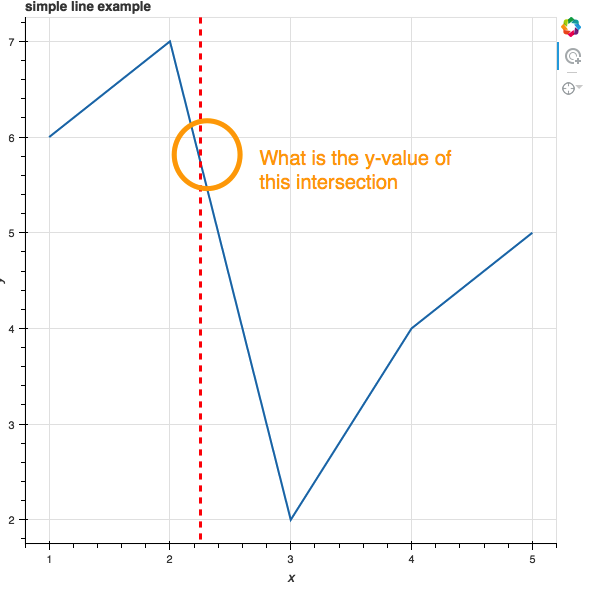
Know I would like to find the y-value of the intersection of the datasource with my span.
Or with other words:
Given a x-value, how can I find the corresponding y-value (as in the figure) of a datasource?
So far I didn’t find find a solution, or I did not know what to look for…
Thanks in advance.
Is your data source a ColumnDataSource? What does it look like?
···
On Wednesday, September 7, 2016 at 8:45:55 AM UTC-4, [email protected] wrote:
Hello all
I managed to write a plot where I can dynamically set a span.
Know I would like to find the y-value of the intersection of the datasource with my span.
Or with other words:
Given a x-value, how can I find the corresponding y-value (as in the figure) of a datasource?
So far I didn’t find find a solution, or I did not know what to look for…
Thanks in advance.
The source is indeed a ColumnDataSource. The source data in the image is just from one of the examples in the docs.
But in my application I also use ColumnDataSources. The red line is a span.
But I know the x location value of the span in my JavaScript Callback.
···
On Wednesday, 7 September 2016 17:38:52 UTC+2, Reuben Jacobs wrote:
Is your data source a ColumnDataSource? What does it look like?
On Wednesday, September 7, 2016 at 8:45:55 AM UTC-4, [email protected] wrote:
Hello all
I managed to write a plot where I can dynamically set a span.
Know I would like to find the y-value of the intersection of the datasource with my span.
Or with other words:
Given a x-value, how can I find the corresponding y-value (as in the figure) of a datasource?
So far I didn’t find find a solution, or I did not know what to look for…
Thanks in advance.
Bokeh just does graphics; this is something you should do using another library. This procedure is called “interpolation.”
For example
import numpy as np
x = source.data[‘x’]
y = source.data[‘y’]
interp = np.interp1d(y, x)
some_x = interp(some_y)
···
On Wednesday, September 7, 2016 at 8:45:55 AM UTC-4, [email protected] wrote:
Hello all
I managed to write a plot where I can dynamically set a span.
Know I would like to find the y-value of the intersection of the datasource with my span.
Or with other words:
Given a x-value, how can I find the corresponding y-value (as in the figure) of a datasource?
So far I didn’t find find a solution, or I did not know what to look for…
Thanks in advance.
Sorry that function is in scipy; the import should be from scipy.interpolate import interp1d. Maybe there is something similar in numpy but I used the scipy syntax in my example.
···
On Tuesday, September 20, 2016 at 8:26:07 PM UTC-4, Henry Harrison wrote:
Bokeh just does graphics; this is something you should do using another library. This procedure is called “interpolation.”
For example
import numpy as np
x = source.data[‘x’]
y = source.data[‘y’]
interp = np.interp1d(y, x)
some_x = interp(some_y)
On Wednesday, September 7, 2016 at 8:45:55 AM UTC-4, [email protected] wrote:
Hello all
I managed to write a plot where I can dynamically set a span.
Know I would like to find the y-value of the intersection of the datasource with my span.
Or with other words:
Given a x-value, how can I find the corresponding y-value (as in the figure) of a datasource?
So far I didn’t find find a solution, or I did not know what to look for…
Thanks in advance.