Hello all
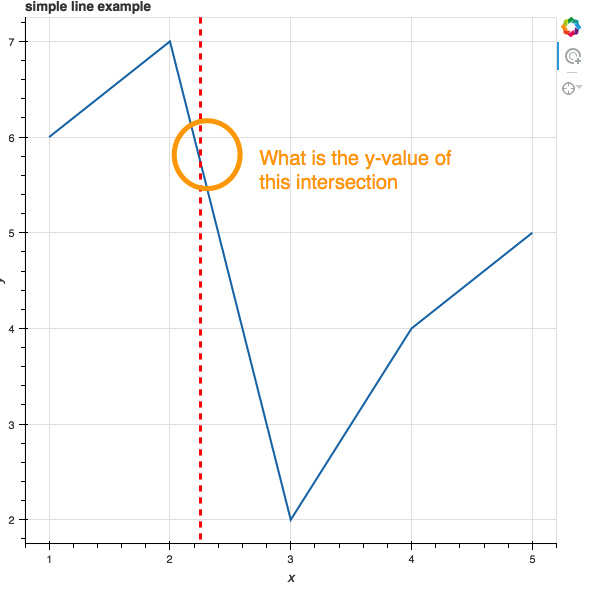
I managed to write a plot where I can dynamically set a span.
Know I would like to find the y-value of the intersection of the datasource with my span.
Or with other words: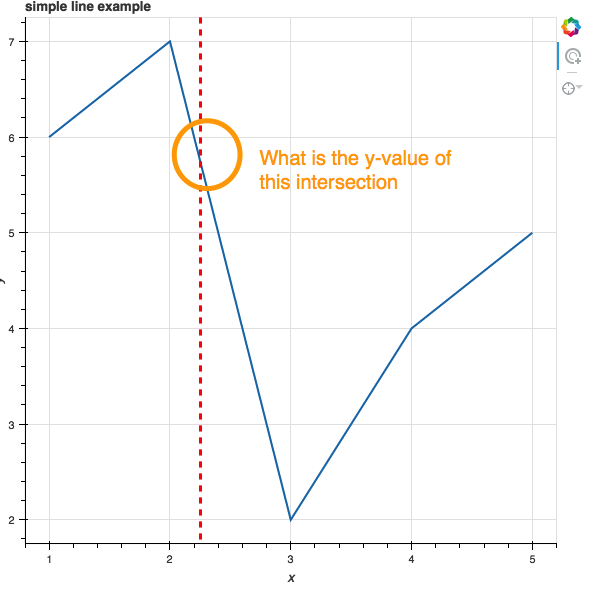
Given a x-value, how can I find the corresponding y-value (as in the figure) of a datasource?
So far I didn’t find find a solution, or I did not know what to look for…
Thanks in advance.