Bokeh visual improvements - animations, tooltips & KPI cards
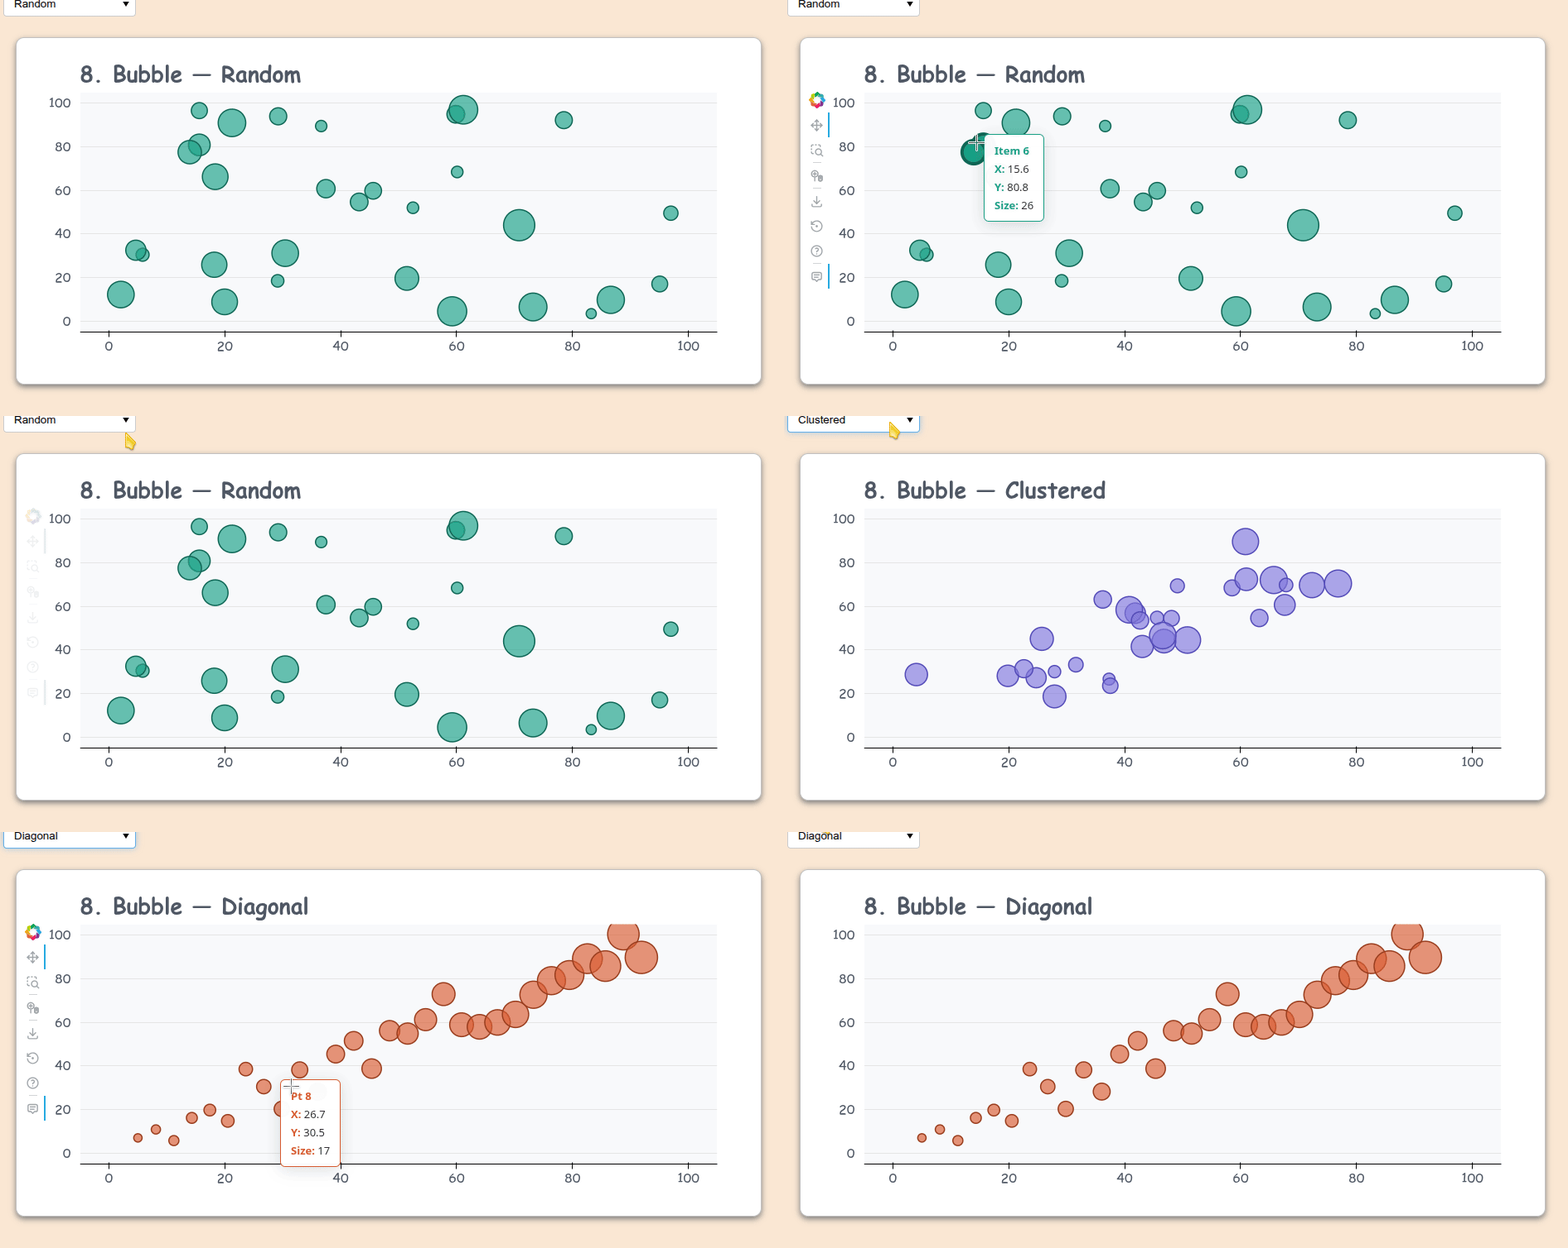
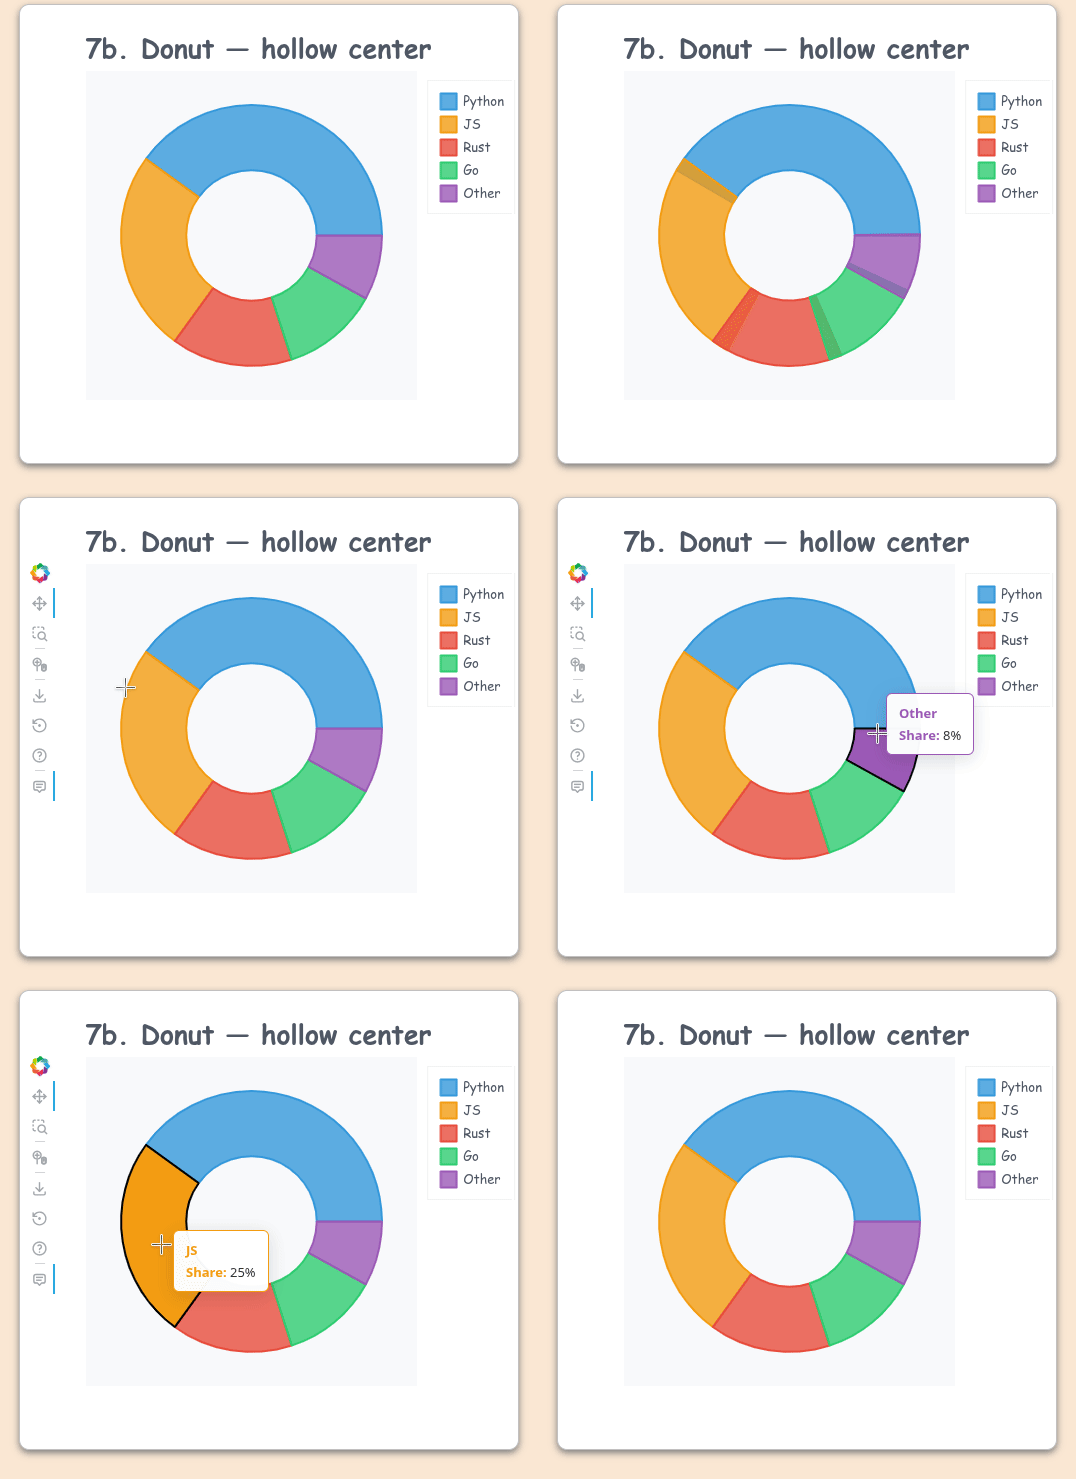
I made Bokeh charts look nicer. Bars grow in, lines draw themselves, bubbles pop, pie wedges sweep. Tooltips float and glide instead of snapping. KPI cards sit alongside your plots. Single HTML file, no server needed — just show() as usual.
Three files, three calls:
anim(p, easing="backOut", duration=800)
smooth_tip(p, src, mode="bar")
kpi_metric_card(label="Revenue", value="$9,150", delta="+12%", direction="up")
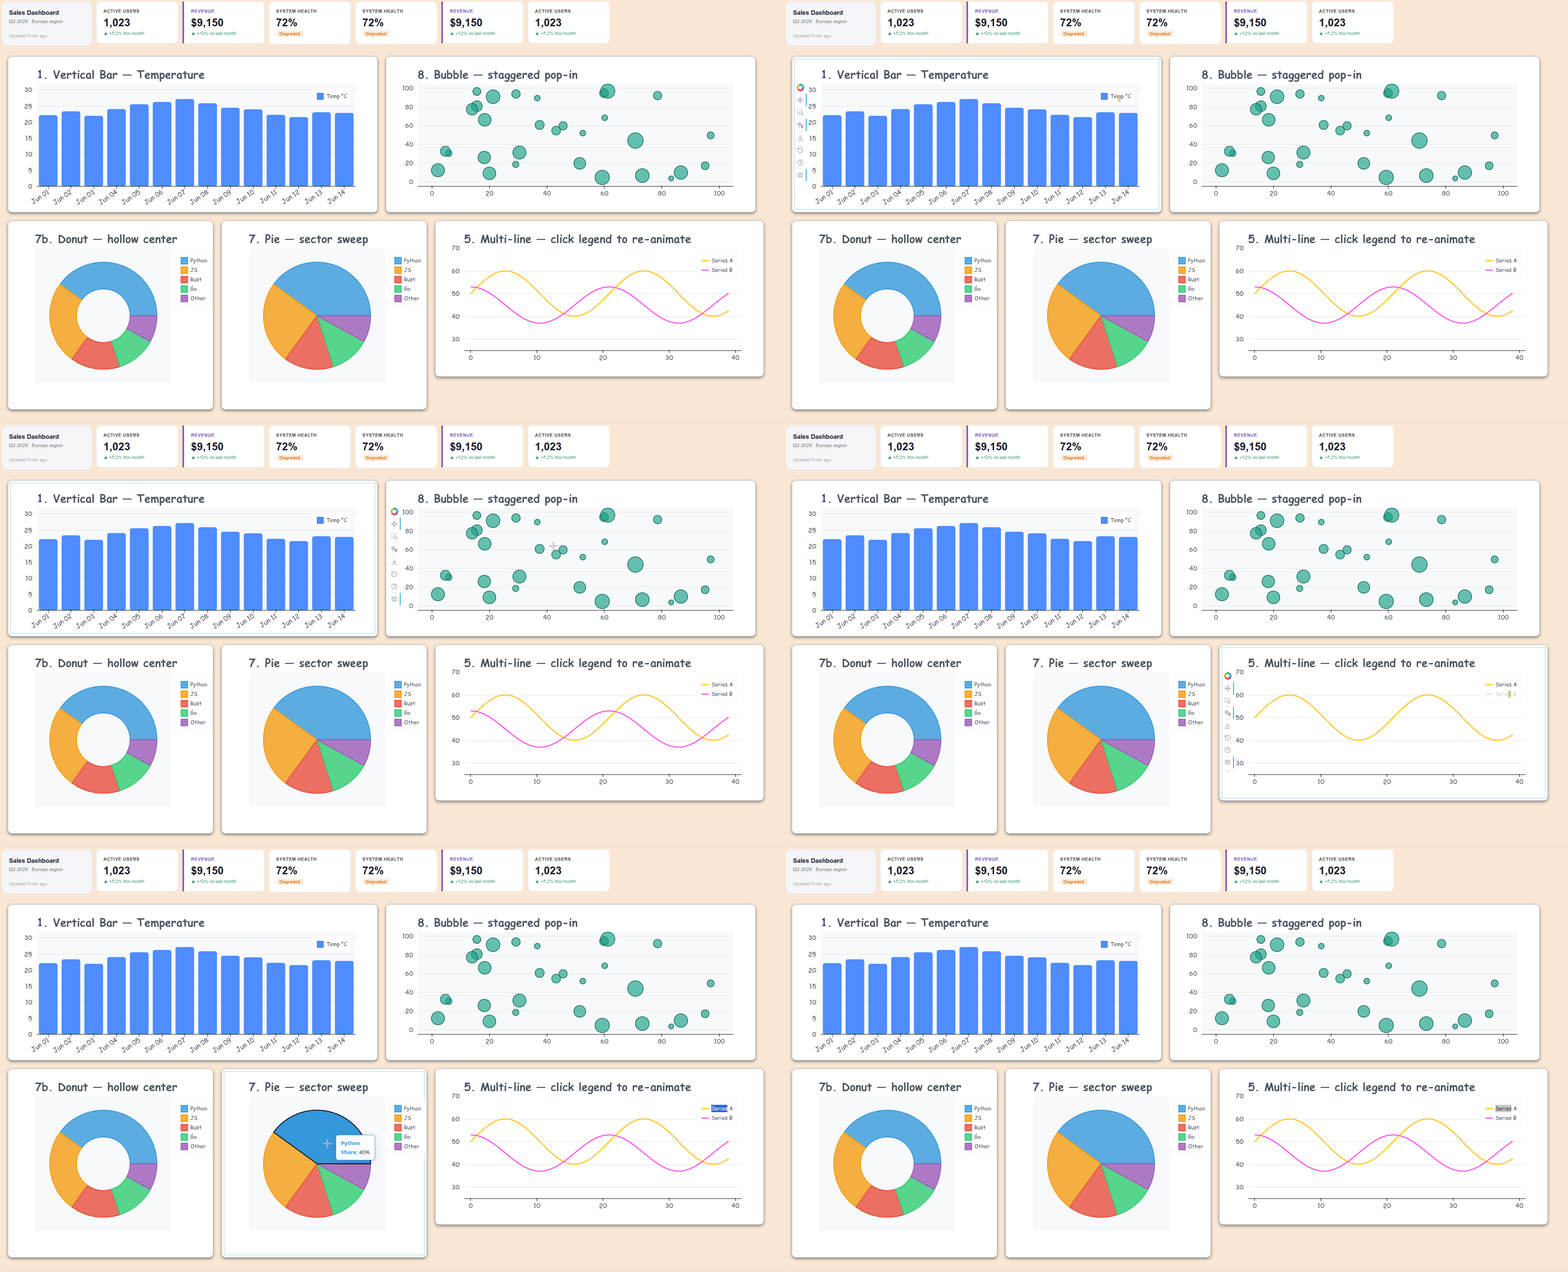
see this: https://github.com/mixstam1821/Bokeh_visual_improving/blob/main/dashboard.py
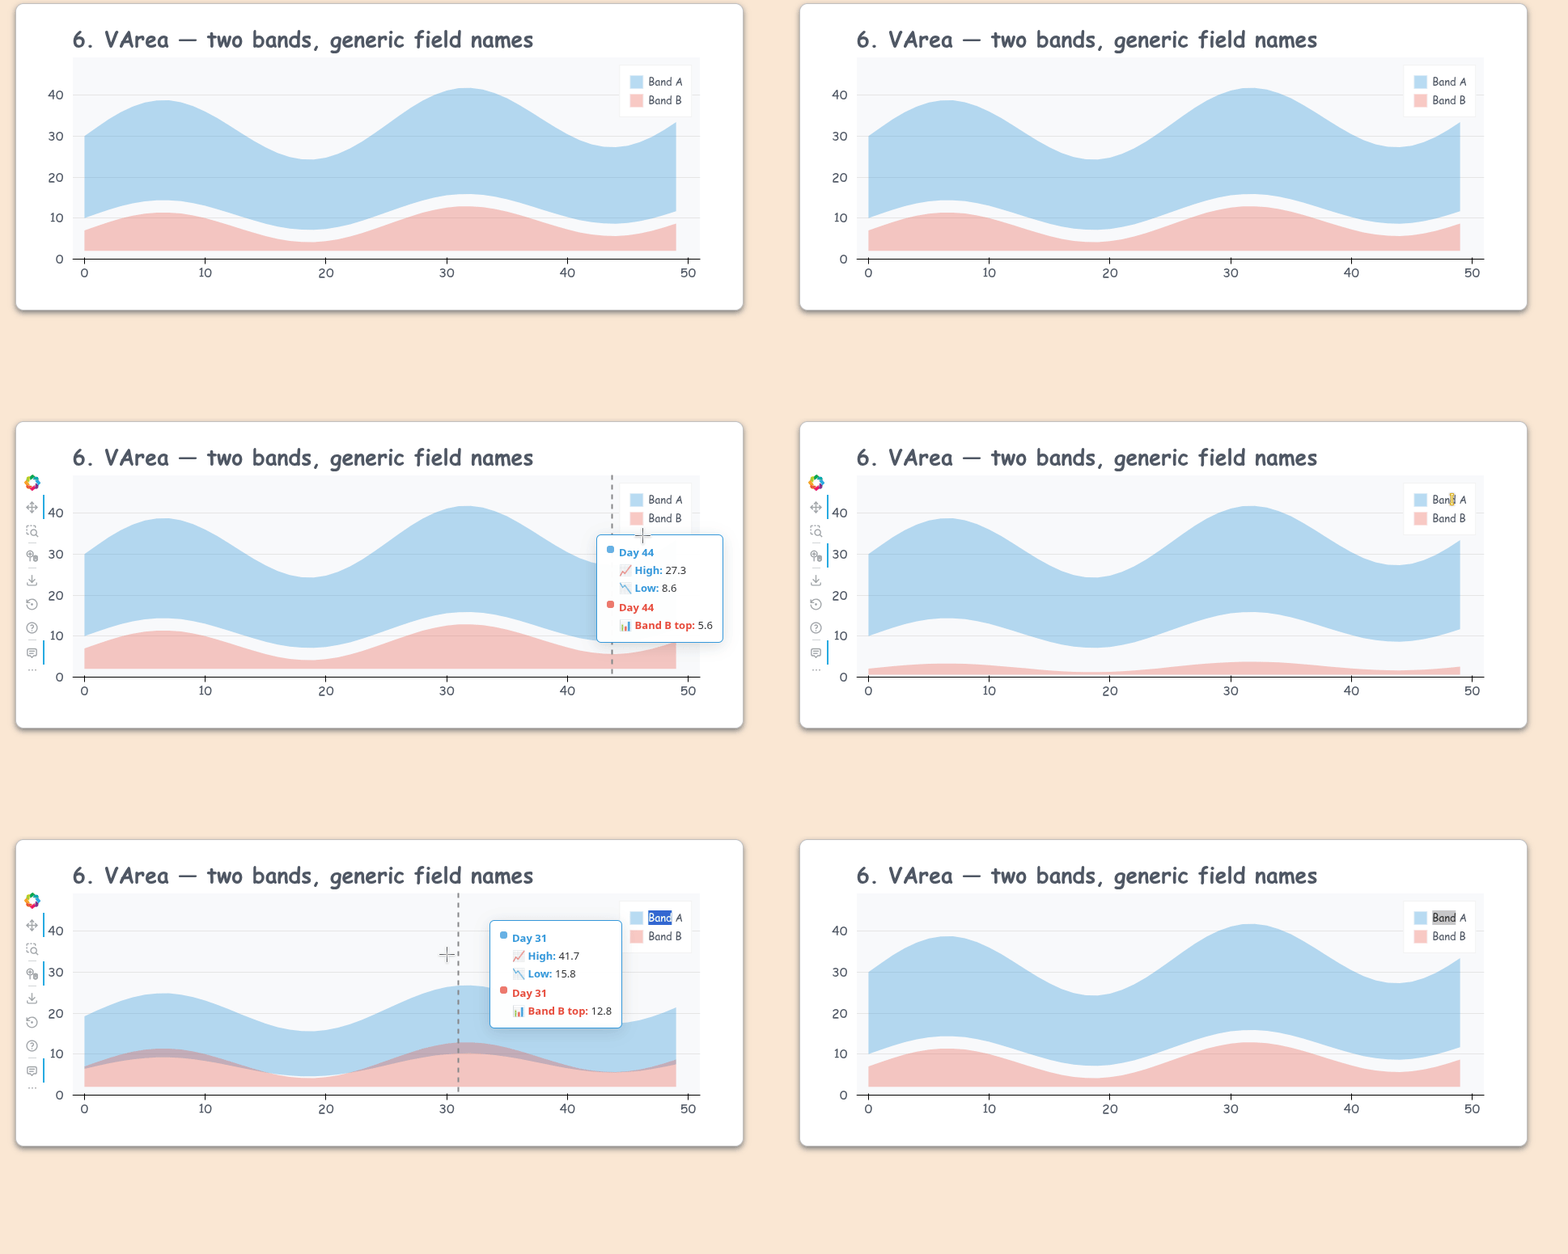
For the rest plots see this file: https://github.com/mixstam1821/Bokeh_visual_improving/blob/main/examples.py
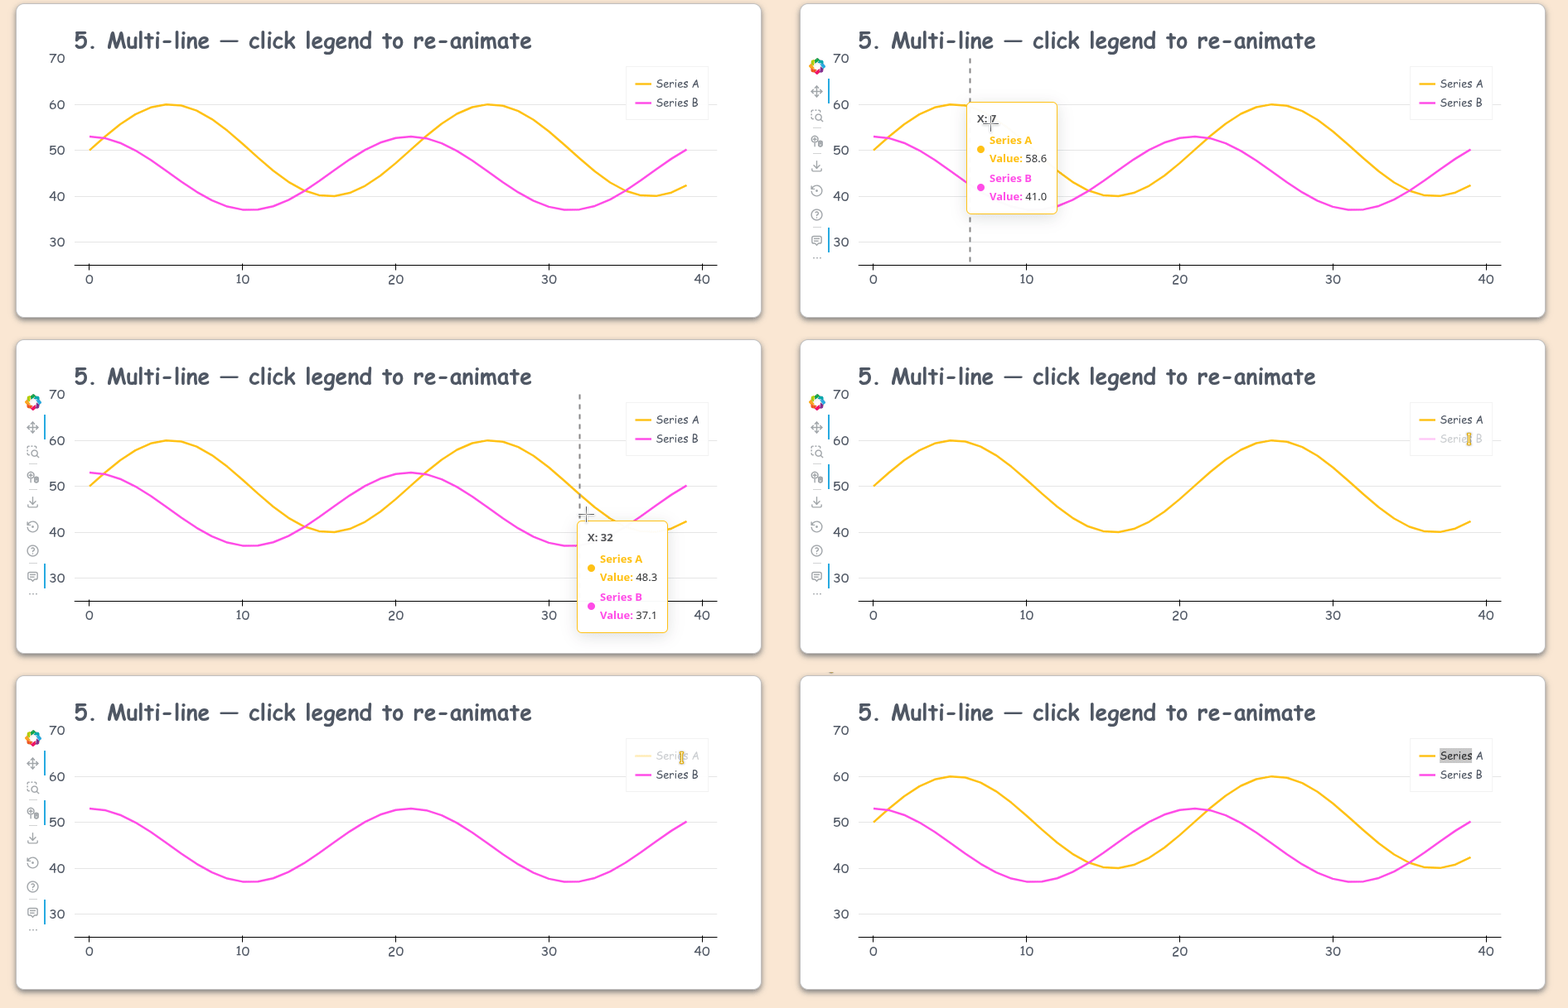
Example for the lines:
n5 = 40
x5 = list(range(n5))
src5a = ColumnDataSource(dict(
    x=x5, y=[math.sin(i * 0.3) * 10 + 50 for i in x5],
    label=[f"<b>Series A</b><br>Value: {math.sin(i*0.3)*10+50:.1f}" for i in x5]
))
src5b = ColumnDataSource(dict(
    x=x5, y=[math.cos(i * 0.3) * 8 + 45 for i in x5],
    label=[f"<b>Series B</b><br>Value: {math.cos(i*0.3)*8+45:.1f}" for i in x5]
))
p5 = figure(title="5. Multi-line — click legend to re-animate", width=900, height=380,
            background_fill_color="white", x_range=(-1, n5 + 1))
r5a = p5.line('x', 'y', source=src5a, line_width=2.5, color="#FFC115", legend_label="Series A")
r5b = p5.line('x', 'y', source=src5b, line_width=2.5, color="#FF4CE7", legend_label="Series B")

p5.y_range.start, p5.y_range.end = 25, 70

p5.add_tools(HoverTool(tooltips=None, renderers=[r5a, r5b]))
# One combined tooltip for both
smooth_tip_multi_line(
    p5,
    sources=[src5a, src5b],
    title="X: {x}",
)
anim(p5, easing="cubicInOut", duration=1400, line_tip=True, line_tip_color="#3498db")
mystyle(p5, cross = True)
show(row(row(p5,rmfocus(p5)), stylesheets=[get_gstyle()]))
 github.com/mixstam1821/Bokeh_visual_improving
Feedback welcome!