Environment Details:
Python version : 3.9.7
IPython version : 7.29.0
Tornado version : 6.1
Bokeh version : 2.4.1
node.js version : (not installed)
npm version : (not installed)
Browsers : Edge, Firefox
I’ve been encountering a small issue with some circle glyphs representing geographical points in a standalone bokeh file using tabs. When changing the zoom or when the glyphs go from on screen to off screen, the circle color changes to the match the color of the final tab.
The code uses a database to show data separated by state, model, and a temperature range with each tab representing a condition. Colors are assigned through a binning process in the CustomJS assigned to the button.
Here is the code in question, I tried my best to minimize the code to the smallest size:
# Imports
from bokeh.models import DataRange1d, ColumnDataSource, CustomJS, ColorBar, LinearColorMapper, Select, MultiChoice, RangeSlider, Button, Tabs, Panel
from bokeh.plotting import figure, show
from bokeh.layouts import layout
from bokeh.tile_providers import CARTODBPOSITRON_RETINA, get_provider
# Initial data
data={
"Ids":["A","B","C","D","E","H","S","Z"],
"ModelNums":["Model1","Model1","Model1","Model4","Model2","Model8","Model1","Model1"],
"State":["Texas","Tennessee","Texas","Texas","Texas","Tennessee","Tennessee","Tennessee"],
"Latitude":[29.63833427,36.55762863,33.23854065,31.06634331,30.428886,35.966297,36.0153693,36.05627556],
"Longitude":[-98.05054474,-85.94697571,-97.89272308,-97.68370819,-97.992195,-83.918365,-83.4148895,-83.71292877],
"Temp":[-9.5,-1,-1,-1,-1,-9.4,4.4,-1],
"Cond1":[25789,44846,31047,25426,16046,54218,19678,32266],
"Cond2":[0,0,190,4711,4080,4060,20520,0]
}
datatitles=['Ids','State','Latitude','Longitude','Temp','Cond1','Cond2']
stateList=["Tennessee","Texas"]
modelTypes=["All"]
conds=["Cond1","Cond2"]
# Build sorted Dataset
sorted_data={'All':{}}
for title in datatitles:
sorted_data['All'][title]=[]
for i,model in enumerate(data.get("ModelNums")):
if model not in sorted_data:
modelTypes.append(model)
sorted_data[model]={}
for title in datatitles:
sorted_data[model][title]=[]
for title in datatitles:
sorted_data[model][title].append(data.get(title)[i])
sorted_data["All"][title].append(data.get(title)[i])
# Create bins and ranges
cond1BinSize=int((max(data.get("Cond1"))+100)/20)
cond2BinSize=int((max(data.get("Cond2"))+100)/20)
cond1Bins=[*range(0,(int(max(data.get("Cond1"))+cond1BinSize)),cond1BinSize)]
cond2Bins=[*range(0,(int(max(data.get("Cond2"))+cond2BinSize)),cond2BinSize)]
cond1BinRanges=[str(cond1Bins[i]) for i in range(0,len(cond1Bins))]
cond2BinRanges=[str(cond2Bins[i]) for i in range(0,len(cond2Bins))]
bins=[cond1Bins,cond2Bins]
binRanges=[cond1BinRanges,cond2BinRanges]
# Color map
colorMap = ["#0cbf10","#1c31d0","#2630c8","#302ebf","#3a2db7","#442bae",
"#4e2aa6","#58289d","#622795","#6c258d","#762484",
"#80227c","#8a2173","#941f6b","#9e1e63","#a81c5a",
"#b21b52","#bc1949","#c61841","#d01638","#da1530",]
# Map Cond1
hov=[('Ids','@Ids')]
tile_provider = get_provider(CARTODBPOSITRON_RETINA)
x_range=(-13900000, -8000000)
y_range=(2850000, 6310000)
cond1 = figure(x_range=x_range,y_range=DataRange1d(start=y_range[0],end=y_range[1]),x_axis_type='mercator',y_axis_type='mercator',height=500,width=800,title="Condition 1",tooltips=hov,)
cond1.add_tile(tile_provider)
for state in stateList:
mapEmpty=ColumnDataSource(data={'x':[0],'y':[0],'circleColor':['#ffffff'],'Ids':["#ffffff"]})
m=cond1.circle(x='x',y='y',color='circleColor',size=10,fill_alpha=0.6,source=mapEmpty,name=state)
colors=LinearColorMapper(palette=colorMap,low=cond1Bins[0],high=cond1Bins[-1])
bar=ColorBar(color_mapper=colors,label_standoff=12)
cond1.add_layout(bar,'right')
# Map Cond2
cond2 = figure(x_range=x_range,y_range=DataRange1d(start=y_range[0],end=y_range[1]),x_axis_type='mercator',y_axis_type='mercator',height=500,width=800,title="Condition 2",tooltips=hov,)
cond2.add_tile(tile_provider)
for state in stateList:
mapEmpty=ColumnDataSource(data={'x':[0],'y':[0],'circleColor':['#ffffff'],'Ids':["#ffffff"]})
m=cond2.circle(x='x',y='y',color='circleColor',size=10,fill_alpha=0.6,source=mapEmpty,name=state)
colors=LinearColorMapper(palette=colorMap,low=cond2Bins[0],high=cond2Bins[-1])
bar=ColorBar(color_mapper=colors,label_standoff=12)
cond2.add_layout(bar,'right')
mapList=[cond1,cond2]
# Widgets
stateSelect = MultiChoice(value=stateList,options=stateList,placeholder="Select State(s)",title="States",sizing_mode="stretch_width")
modelSelect = Select(title="Model#",value="All",options=modelTypes)
tempSelect = RangeSlider(start=int(-50),end=40,step=0.1,title="Temp [C]",value=(-50,40),sizing_mode="stretch_width")
update = Button(label="Update Charts",button_type="success")
# JSCallback
drop_handler = CustomJS(args=dict(drop=modelSelect,multi=stateSelect,slide=tempSelect,
mapList=mapList,allData=sorted_data,
models=modelTypes,titles=datatitles,
bins=bins,colorMap=colorMap,conds=conds
), code="""
//Initialize Variables
var i = 0;
var j = 0;
var k = 0;
var m = 0;
var newDataSource={};
var selModel = drop.value;
var selStates = multi.value;
var numStates = selStates.length;
var selRange = slide.value;
console.log("debug");
//Create the datasource(s) based on selection
for (i=0;i<numStates;i++){
let state = selStates[i];
newDataSource[state]={};
for (j=0;j<models.length;j++){
//Sort by state
if (models[j]==selModel){
let model = allData[models[j]];
newDataSource[state][models[j]]={};
newDataSource[state][models[j]]['colorMap']=[];
for (k=0;k<titles.length;k++){
newDataSource[state][models[j]][titles[k]]=[];
}
//Sort by ModelNum
for (k=0;k<model.Ids.length;k++){
let temp=model['Temp'][k];
//Assign data based on created datasource(s)
if (selRange[0]<= temp && temp <= selRange[1]){
let s=model.State[k];
if (s==state){
for (m=0;m<titles.length;m++){
newDataSource[state][models[j]][titles[m]].push(model[titles[m]][k]);
//newDataSource[state][models[j]][titles[m]].length=newDataSource[state][models[j]][titles[m]].length+1;
}
}
}
}
newDataSource[state][models[j]]['colorMap'].length=newDataSource[state][models[j]]['Ids'].length;
}
}
}
//Bin data and assign color based on bin
for (i=0;i<mapList.length;i++){
let map = mapList[i];
let condBin = bins[i];
let cond = conds[i]
for (j=0;j<numStates;j++){
let state = selStates[j];
let bin = new Array(condBin.length).fill(0);
for (k=0;k<condBin.length;k++){
bin[k]=condBin[k];
}
bin.splice(1,0,1);
let numDataPoints = newDataSource[state][selModel][cond].length;
let left = bin.slice();
left.splice((left.length)-1,1);
let right = bin.slice();
right.splice(0,1);
for(k=0;k<newDataSource[state][selModel][cond].length;k++){
let val = newDataSource[state][selModel][cond][k];
for (m=0;m<(bin.length);m++){
let l = left[m];
let r = right[m];
if (l <= val && val < r){
newDataSource[state][selModel]['colorMap'][k]=colorMap[m];
}
else if (m==21 && val >=right[20]){
newDataSource[state][selModel]['colorMap'][k]=colorMap[20];
}
}
}
//Update Maps
let x = new Array(newDataSource[state][selModel]['Ids'].length).fill(0);
let y = new Array(newDataSource[state][selModel]['Ids'].length).fill(0);
let cart = 6378137;
for (k=0;k<newDataSource[state][selModel]['Ids'].length;k++){
let yval = newDataSource[state][selModel]['Latitude'][k];
let xval = newDataSource[state][selModel]['Longitude'][k];
x[k] = xval*(cart*Math.PI/180.0);
y[k] = Math.log(Math.tan((90+yval)*Math.PI/360.0))*cart
}
let colors = newDataSource[state][selModel]['colorMap'];
let Ids = newDataSource[state][selModel]['Ids'];
let data = {x:x,y:y,circleColor:colors,Ids:Ids};
let renderers = map.renderers;
for (k=0;k<renderers.length;k++){
let d = renderers[k];
if (d.name==state){
d.data_source.data=data;
d.change.emit();
mapList[i].change.emit();
}
}
}
}
""")
update.js_on_click(drop_handler)
# Build Layouts, Panels, Tabs
cond1_layout=layout([cond1],[update,modelSelect,tempSelect],[stateSelect])
cond2_layout=layout([cond2],[update,modelSelect,tempSelect],[stateSelect])
cond1_tab=Panel(child=cond1_layout,title="Cond1")
cond2_tab=Panel(child=cond2_layout,title="Cond2")
MapTabs=Tabs(tabs=[cond1_tab,cond2_tab])
show(MapTabs)
Here are some example pictures showing the change happening (sorry about the quality):
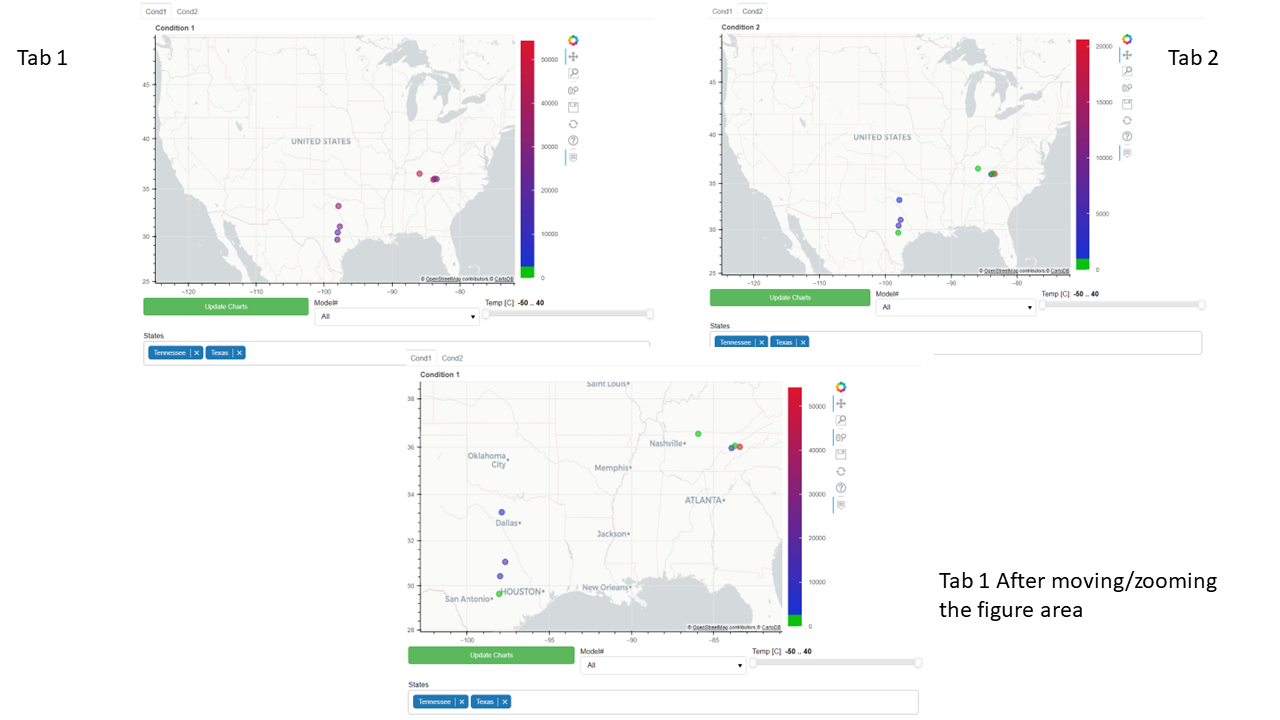
At this point I’m not too certain what could be causing the issue. I suspect it has something to do with how I’m assigning the new data to the each tabbed figure’s renderers in a loop, but I cant say for sure.
It is a minor issue since the update button can be clicked after moving the chart area. However I would like to figure out if the problem is from my JSCallback as I’m very new to JS.