☰Read-only archive⌕
Looking for help with Bokeh?

This is a read-only archive. Ask questions and join the conversation on GitHub.

Visit Community Support on GitHub →
Archived discussions · Captured October 28, 2026

Google App Engine + Bokeh Server + Flask

Community Support
BryceWayne
BryceWayne

Hello, I have been trying to deploy a canonical example on Google App Engine (GAE) and deploy it but I am running into problems.

  1. I can not see the Bokeh Plot embed into my localhost:8080
  2. I can see the Bokeh Plot at localhost:5006
  3. I am unable to deploy the app as a result.

I have the GitHub Repo here: https://github.com/BryceWayne/mlcdashboard.git

I cannot put the full Bokeh Server response because of link limitations.

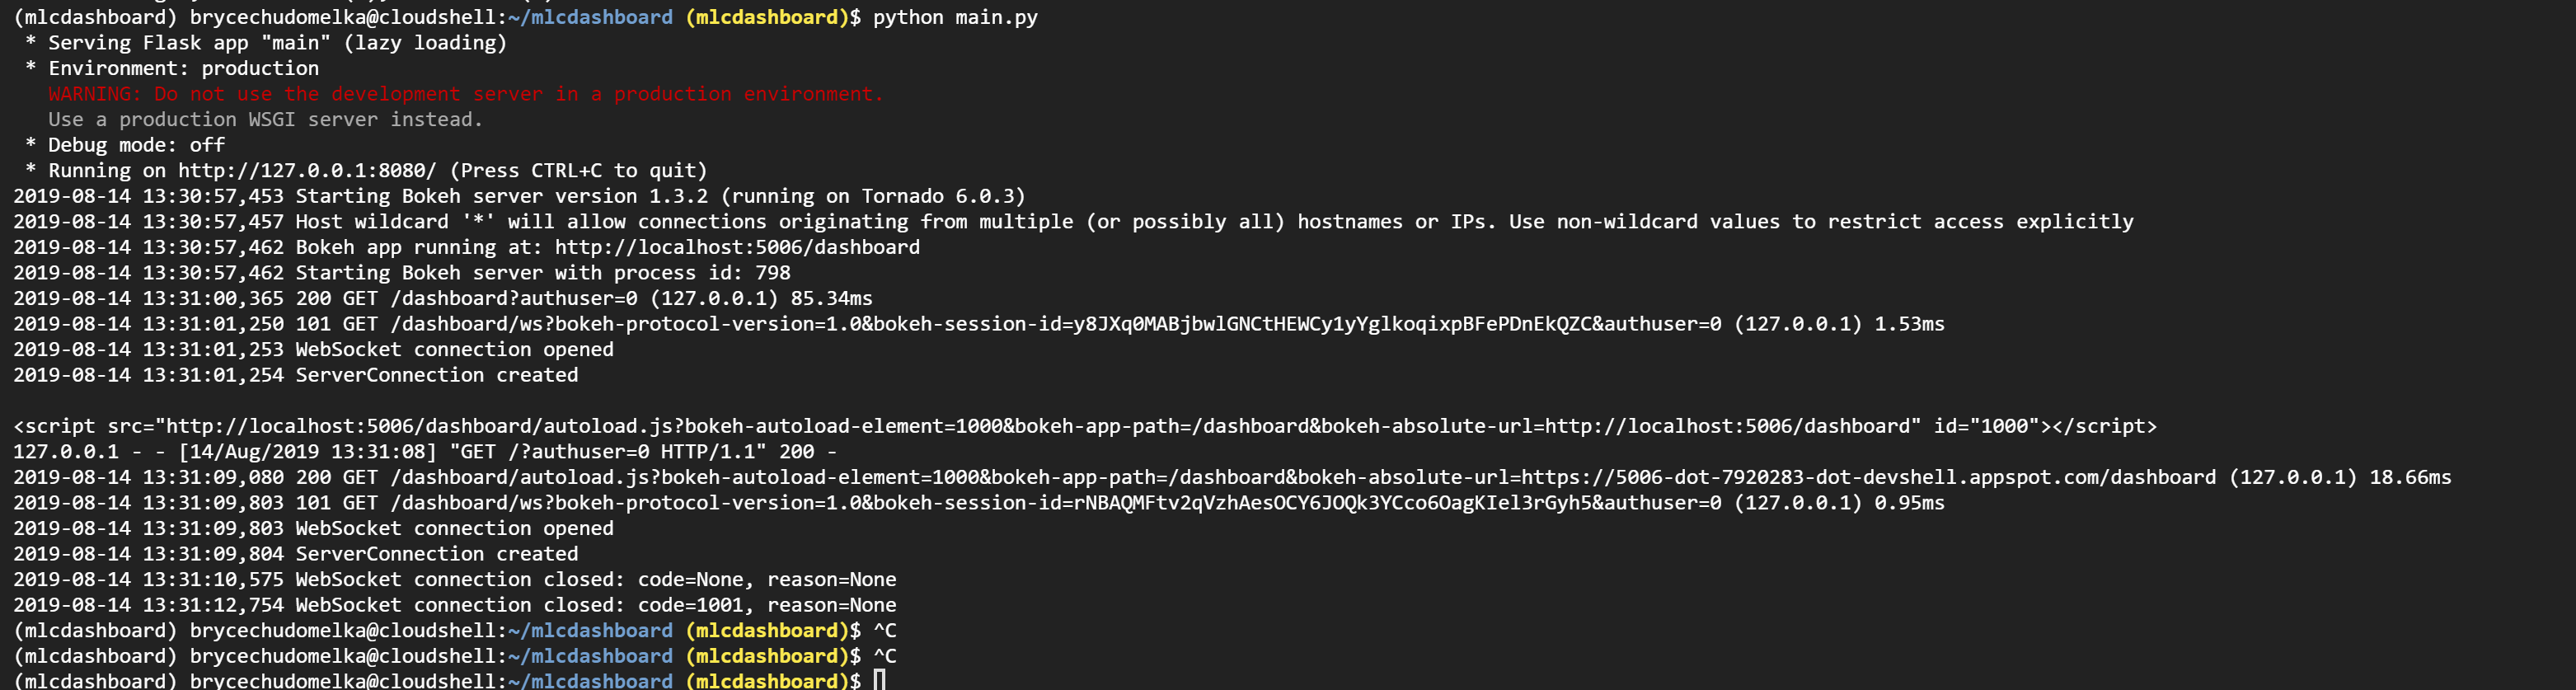
Edit: I am attaching a screenshot of the output of Bokeh Server
⌁   Link to post
Bryan
Bryan

@BryceWayne When I run your code with

gunicorn -b :8080 main:app 

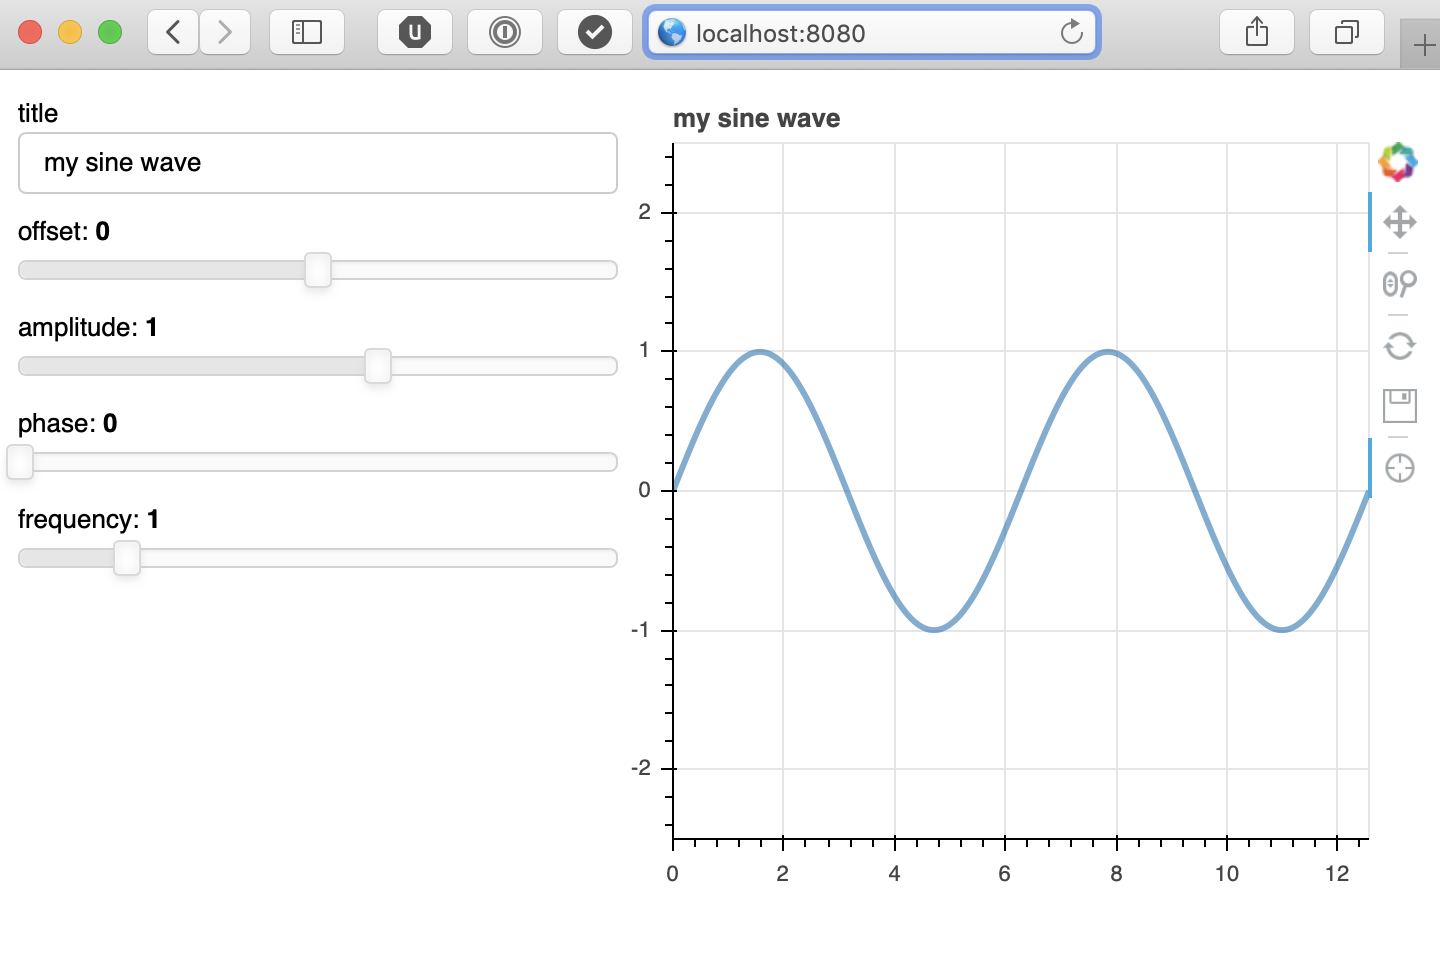
I am able to see the plot at localhost:8080:

If things are not working then somewhere there is a useful log message (either in the brower JS console or the bokeh server process logs). I don’t think there is any chance of figuring things out without knowing what the logs report.

⌁   Link to post
BryceWayne
BryceWayne

Hello @Bryan,

I just attached a screenshot of the Bokeh Server output. I am looking for the Google Ap Engine log and there is no error being reported. Thanks for your help. I am also able to get the server working on my local machine as well which is interesting.

⌁   Link to post
Bryan
Bryan

OK well I was basing my statement off of this:

  1. I can not see the Bokeh Plot embed into my localhost:8080

If you can see things locally then the local logs are not going to be helpful. When you say “Google App Engine log”, do you mean the Bokeh server logs, as reported by GAE? Or some different GAE-specific log? I am asking about the former. There presumably must be some way to access the logs for the Bokeh server running on GAE and this is what will show connection attempts (or lack thereof) as well as any connection refusals. Also, again, the browser JavaScript log is another source of important information about connection attempts and failures. Every browser is different, you will have to GIS how to look up the JS logs on whatever browser you are are using.

⌁   Link to post
BryceWayne
BryceWayne

The screenshot I attached is from the Google App Engine Terminal itself and those logs are what GAE is outputting. The Google App Engine log is where errors/bugs get reported to, such as build errors etc, and there have not been any errors or bugs. I will look into the JS log you are mentioning.

⌁   Link to post
Bryan
Bryan

OK well if that is from GAE, then the websocket connection is being opened, and a session created for it, but the websocket is getting immediately closed. The reported code=1001 is CLOSE_GOING_AWAY which normally indicates that the browser tab has closed or otherwise navigated away from the page.

⌁   Link to post
Bryan
Bryan

I doubt that is related. Session affinity refers to configuring the proxy to make sure that, after the initial HTTP connection, the subsequent websocket upgrade lands on the same process.

It’s perhaps the case that I have not stressed enough how important the browser console logs are. They are 100% the next best hope of obtaining relevant information.

⌁   Link to post
Bryan
Bryan

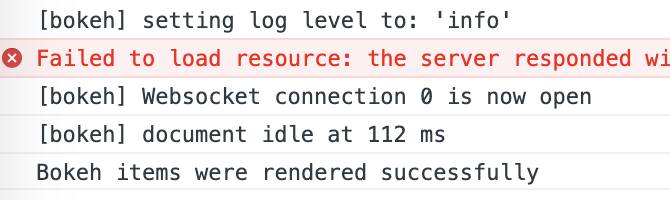
The logs I am asking about are in your browser, e.g a successful connection looks like this in the Chrome debugger:

38%20PM

Presumably (hopefully) there will be some additional information when things are failing.

⌁   Link to post

End of archived discussion · Replies are disabled