Hey guys,
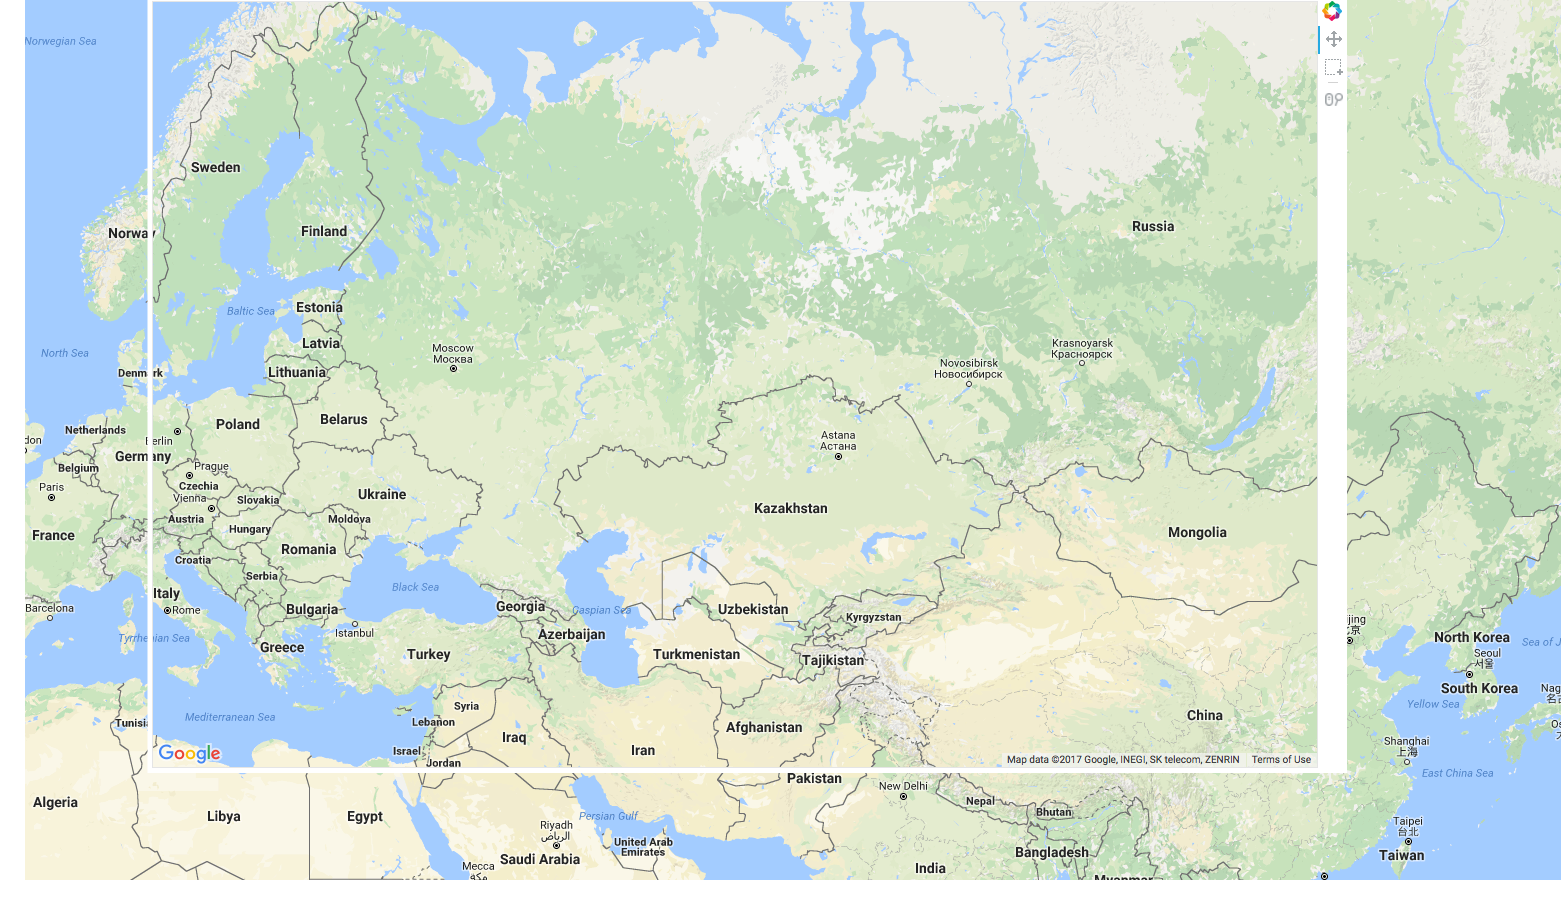
I am making a map chart using Google maps as base tile. It worked amazing a few weeks ago. Last week when I open the plot for some reason the tile spills over the chart border, and covers up the checkbox pane.
A screenshot is attached below.
Would love to hear your thoughts on what might be going on.
Thanks!
Dongxu
please see Redirecting to Google Groups
···
On Wednesday, February 1, 2017 at 10:34:03 AM UTC-6, Dongxu Zhou wrote:
Hey guys,
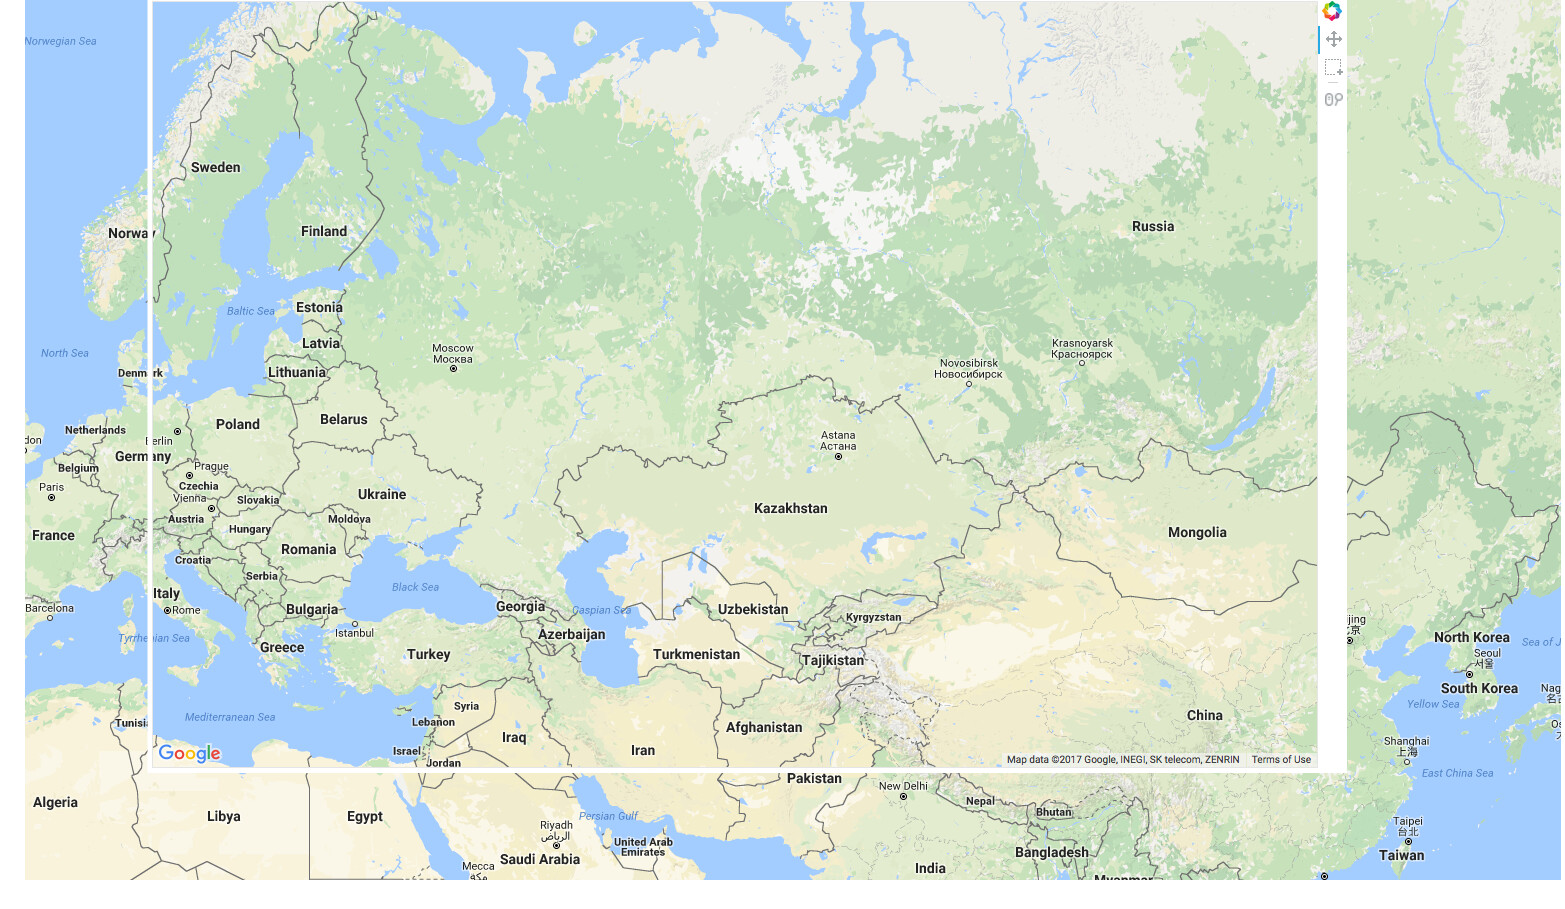
I am making a map chart using Google maps as base tile. It worked amazing a few weeks ago. Last week when I open the plot for some reason the tile spills over the chart border, and covers up the checkbox pane.
A screenshot is attached below.
Would love to hear your thoughts on what might be going on.
Thanks!
Dongxu
It works. Thank you Robbie!
···
On Wednesday, February 1, 2017 at 9:06:08 AM UTC-8, Robbie Pritchard wrote:
please see https://groups.google.com/a/continuum.io/forum/?utm_medium=email&utm_source=footer#!topic/bokeh/4GaPygTvhC8
On Wednesday, February 1, 2017 at 10:34:03 AM UTC-6, Dongxu Zhou wrote:
Hey guys,
I am making a map chart using Google maps as base tile. It worked amazing a few weeks ago. Last week when I open the plot for some reason the tile spills over the chart border, and covers up the checkbox pane.
A screenshot is attached below.
Would love to hear your thoughts on what might be going on.
Thanks!
Dongxu