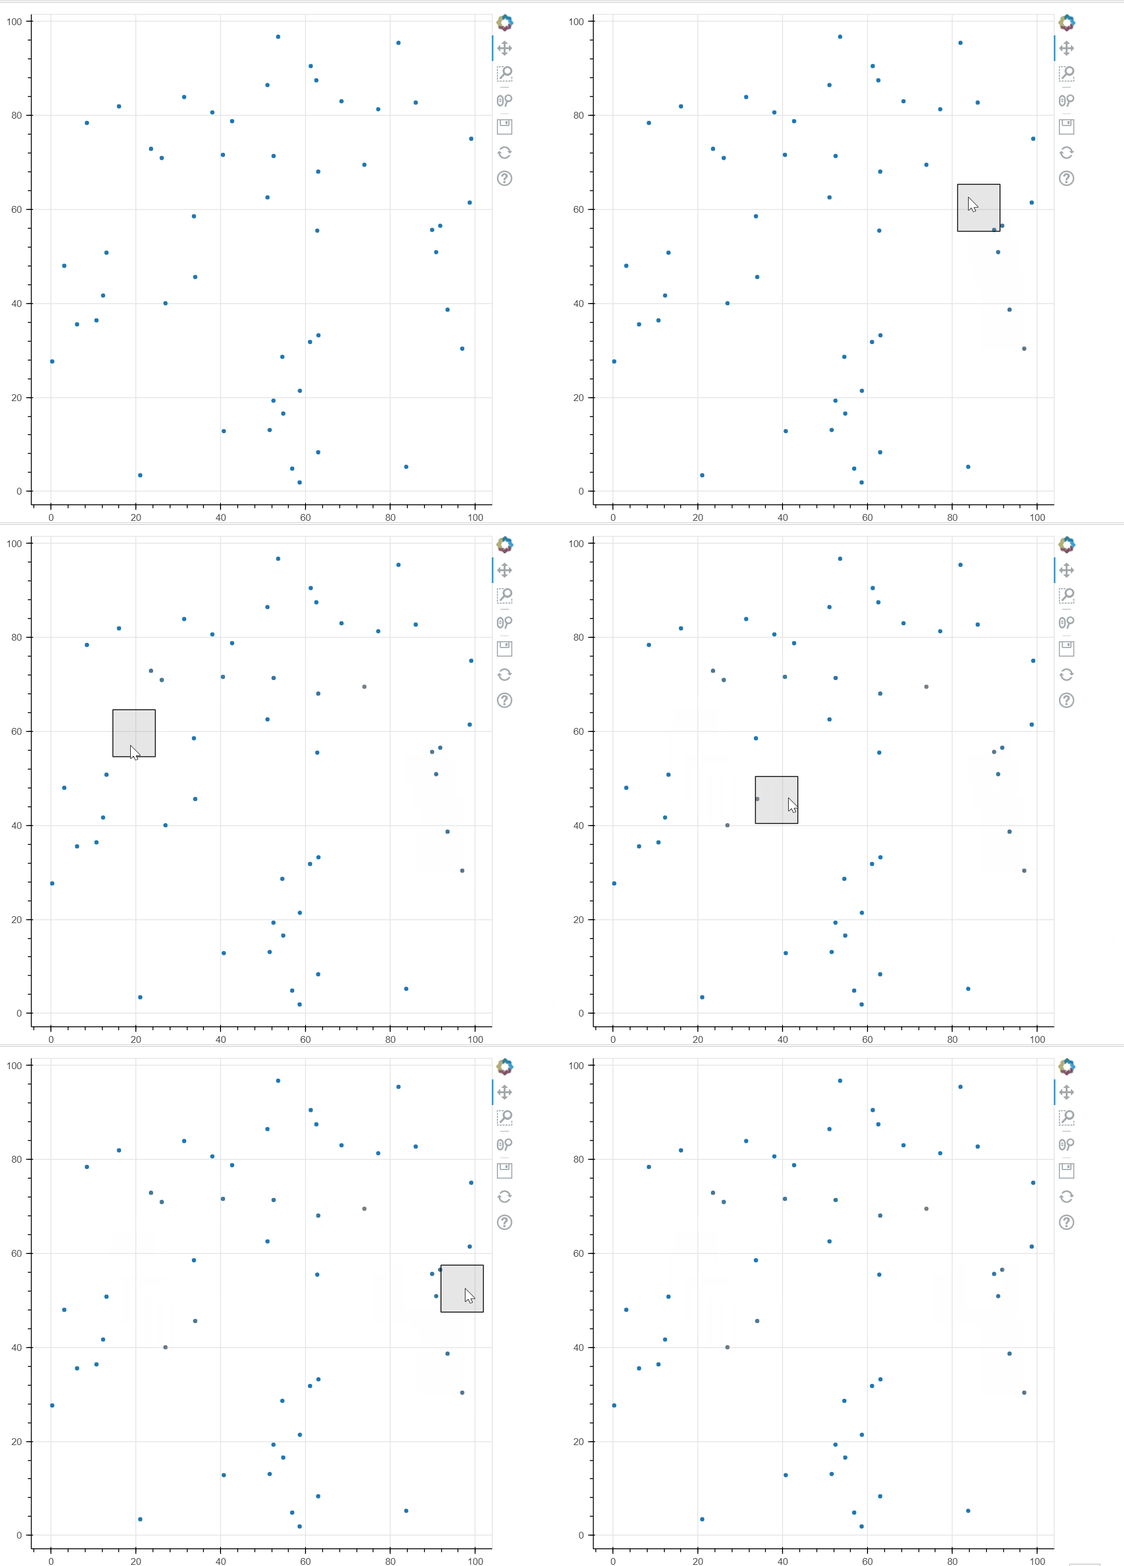
Yes, you can use a mousemove event and CustomJS to accomplish this. The idea is to make a Rect glyph/renderer and update the ColumnDataSource driving it based on the user’s mouse movement:
import numpy as np
from bokeh.plotting import figure, show, save
from bokeh.models import Rect, ColumnDataSource, CustomJS

#make the figure and plot your stuff
f = figure()
dsrc = ColumnDataSource(data={'x':np.random.random(50)*100,'y':np.random.random(50)*100})
r = f.scatter(x='x',y='y',source=dsrc)

#tell the figure's dataranges to only follow your data and no other renderers
#(i.e. we don't want the figure's x/y range to adjust based on the highlight area )
f.x_range.renderers = [r]
f.y_range.renderers = [r]

#make a cds for the "highlight", initialized with empty lists
rdata={'x':[],'y':[],'w':[],'h':[]}
rsrc = ColumnDataSource(rdata)
#make a rect glyph running off the fields in this src, with properties to make it look "highlighty"
rectglyph = Rect(x='x',y='y',width='w',height='h',fill_color='grey',fill_alpha=0.2)
#generate the renderer driving off rsrc
rectrend = f.add_glyph(source_or_glyph=rsrc,glyph=rectglyph)
#callback to trigger on mousemove event within the figure:
    #when triggered, retrieve the mouse's x and y position (cb_obj.x and cb_obj.y)
    #update the source driving the highlight glyph accordingly
#hard coded in width and height here but you could easily add sliders or something to make that user-adjustable as well
cb = CustomJS(args=dict(rsrc=rsrc)
              ,code='''
              rsrc.data = {'x':[cb_obj.x],'y':[cb_obj.y],'w':[10],'h':[10]}
              rsrc.change.emit()
              ''')
#assign this callback to occur on mousemove
f.js_on_event('mousemove',cb)
#final callback, we want to "reset" rsrc when the user's mouse leaves the figure
#this will make the highlight area "disapear" when the mouse leaves
f.js_on_event('mouseleave',CustomJS(args=dict(rsrc=rsrc,rdata=rdata)
                                    ,code='''
                                    rsrc.data=rdata
                                    rsrc.change.emit()
                                    '''))
show(f)