
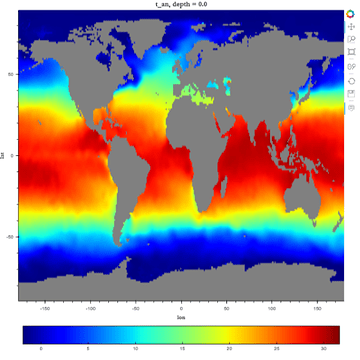
I recently started using Bokeh and I’m very impressed. It’s the first time I’ve come across something that I think allows proper scientific web apps to be developed.
A suggestion for future versions would be an automatic colourbar for image plots, as knowing the relationship between colours and values is essential for scientific plots. I just posted a workaround to this StackExchange item building on work done by others, but it would be nice to have this in core Bokeh functionality if possible.
Thanks and keep up the great work!
Marcus.

