

I’m working on a dashboard which monitors input/output error. The ratio of correct data is 1:1 with a min/max range of about (10,300). Common examples will be (20,100) or (20,150) range, but I can also have the higher end of 300. Here are a few examples:
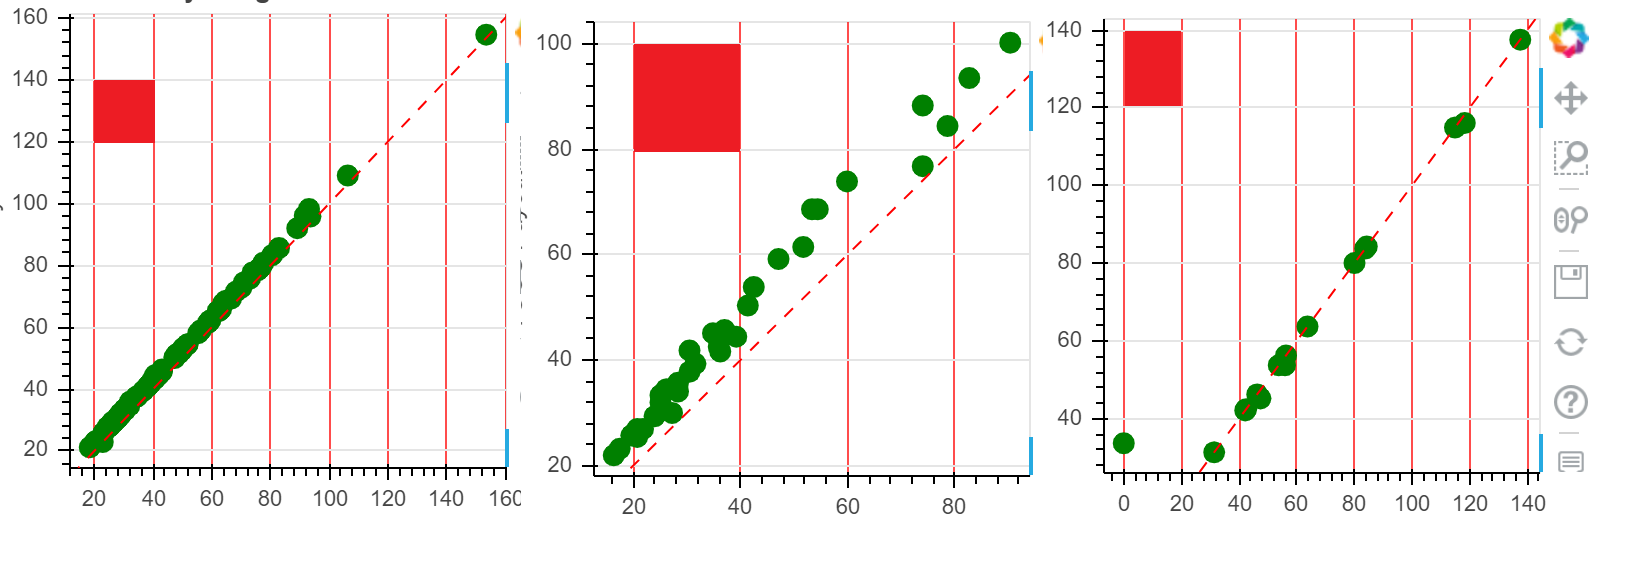
[Note. I added the red boxes with an editor to emphasize the grid proportions and scale; this is not in the plot]
To make the plot easier to interpret, I wish to add a grid background with distinct color every 10 units. The grid should maintain the same square proportions, but the scale can change with the data.
I’ve tried FixedTicker(), but I lose the auto-scaling.
xgrid.grid_line_color is Ok, and it’s what you seen in the example, but the proportions are not maintained, it’s not marked out in units of 10, and I can’t seem to get any minor graph lines (for values between 10).
Appreciate any suggestions.

