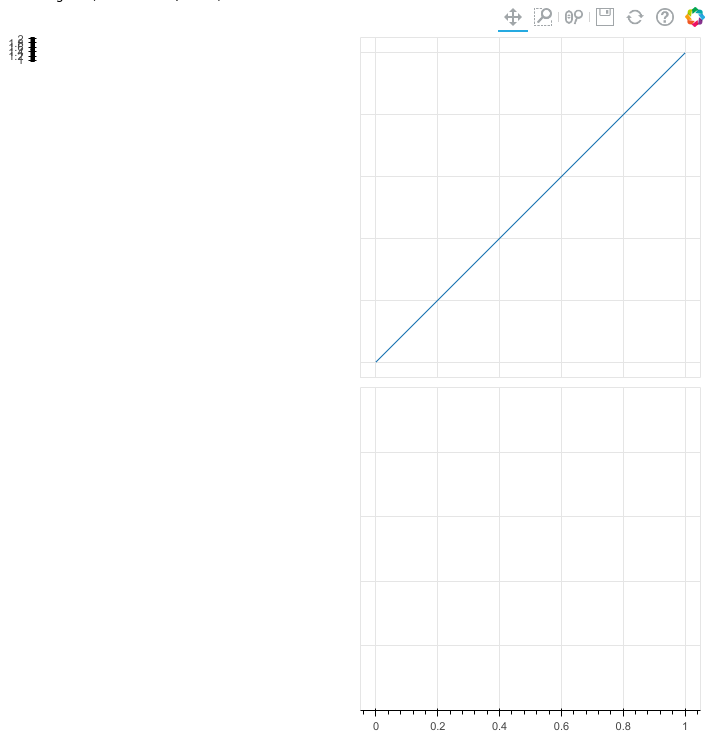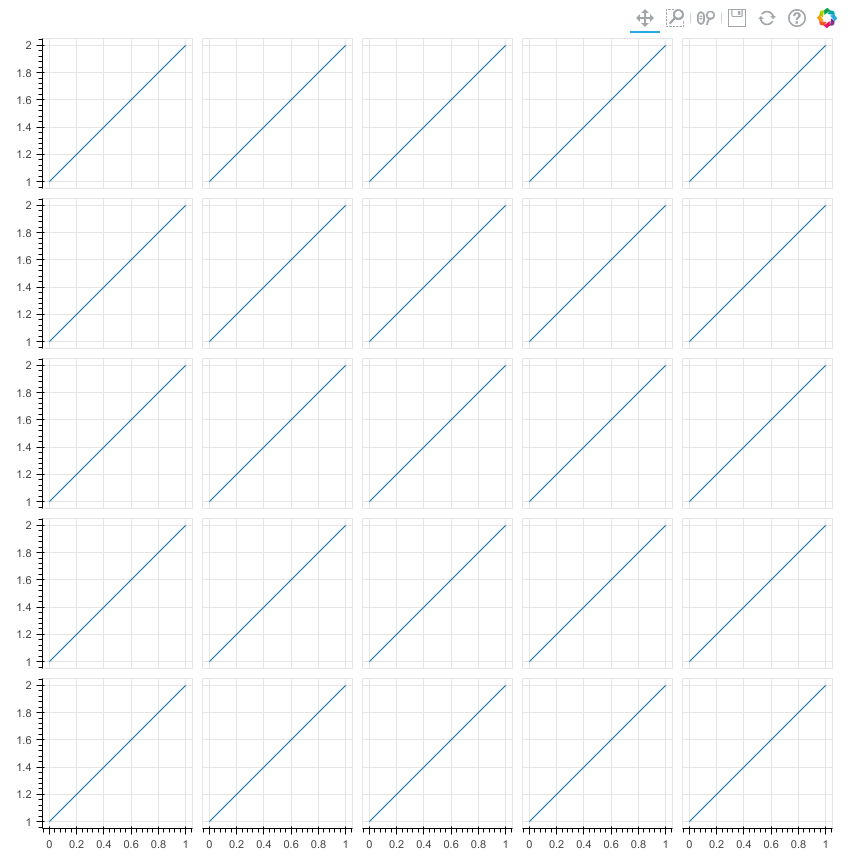
I’m trying to create a square grid of plots, where the x-axis is the same in each column and the y-axis is the same in each row, so that I can save space by making axes invisible, except in the first column and the last row. The grid should be responsive, and all plotting areas should have the same size. The goal is to create a pairplot.
Here is a simplified version of my attempt and the result:
ps = []
n = 5
for i in range(n):
    for j in range(n):
        p = figure()
        p.line([0, 1], [1, 2])
        p.xaxis.visible = (i == n - 1)
        p.yaxis.visible = (j == 0)
        ps.append(p)
gp = gridplot(ps, ncols=n, sizing_mode='scale_width')
show(gp)
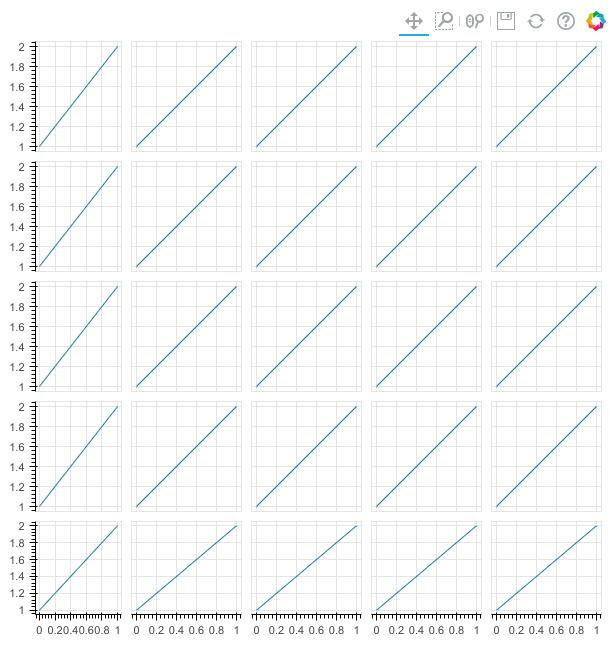
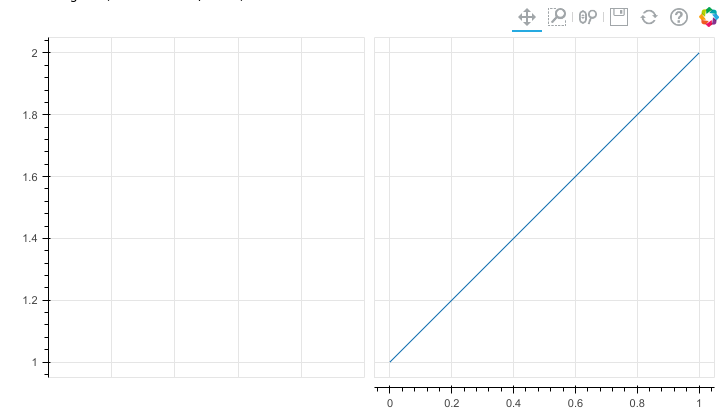
The problem is that the plots in the first column are less wide, and those in the last row are less high, probably to make space for the axes.
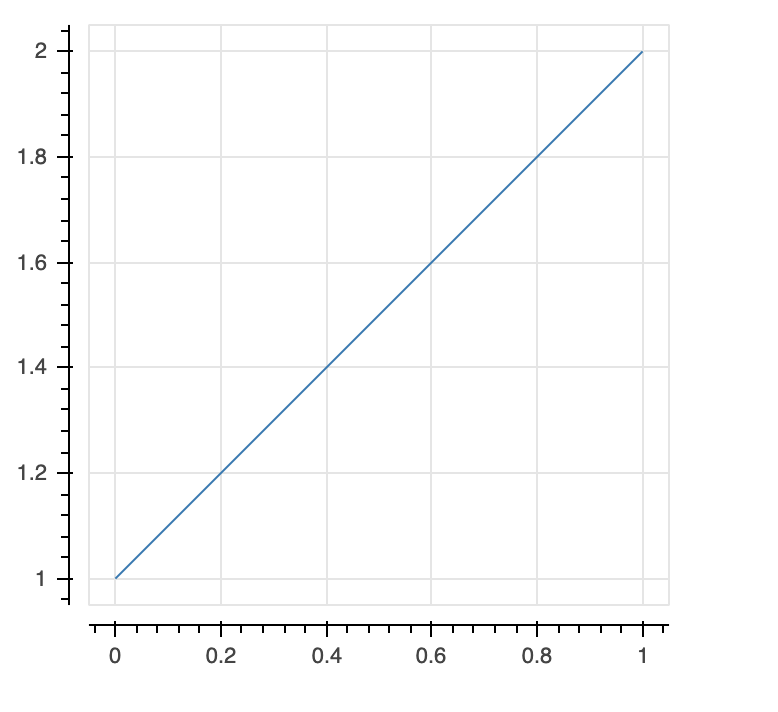
I tried to solve this by adding aspect_ratio=1 to figure, but that makes no difference. I’m guessing the aspect ratio applies to the full width and height of a plot, not the inner plotting area (or ‘frame’).
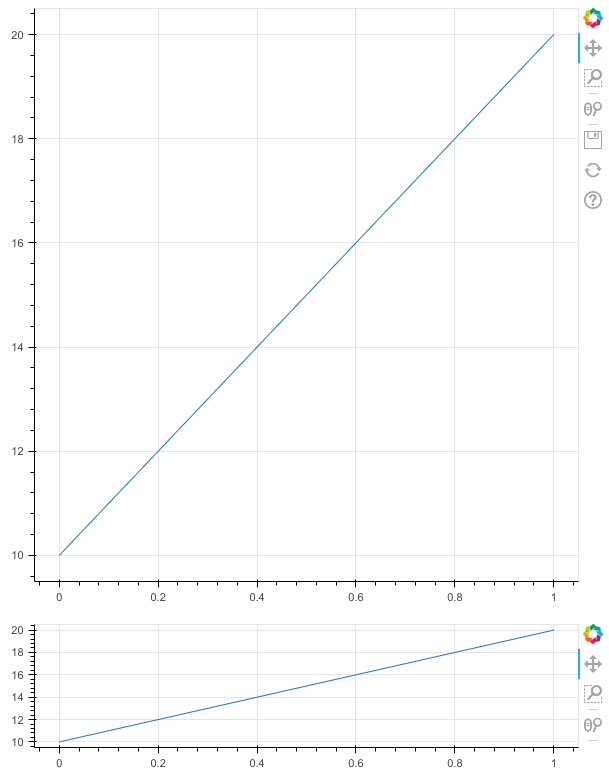
I also tried other sizing_modes, but none of them help.