
☰Read-only archive⌕
Looking for help with Bokeh?

This is a read-only archive. Ask questions and join the conversation on GitHub.

Visit Community Support on GitHub →
Archived discussions · Captured October 28, 2026

Hack: Lasso in datashader/InteractiveImage

Community Support
Todd_Boland
Todd_Boland

Hello,

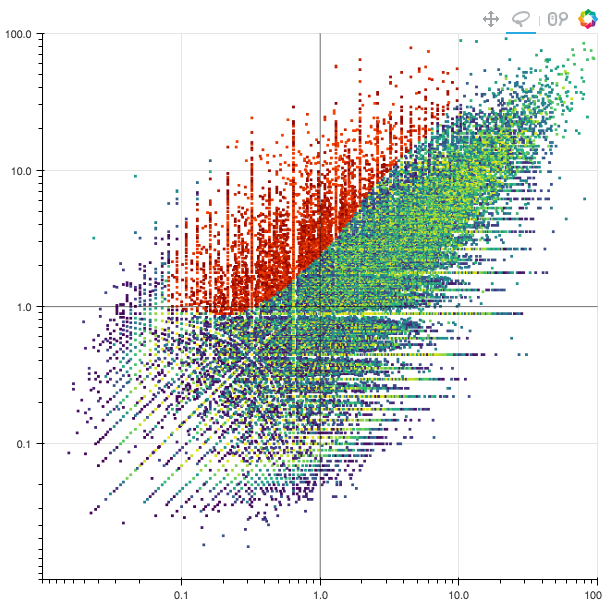
I had a need to plot more datapoints than Bokeh alone could handle. I started using datashader but needed the ability to lasso data. I was able to hack together a decent solution. I am including it below for anyone that may find it useful before InteractiveImage becomes part of Bokeh proper and thus integrated with the native lasso tool. The below code should work in jupyter with datashader 0.4.0 and Bokeh 0.12.4. I included a screen shot that shows the functionality post-lasso selection.

from datashader.bokeh_ext import InteractiveImage

from datashader.utils import export_image

from bokeh.models import Span, NumeralTickFormatter

from bokeh.models import LassoSelectTool, CustomJS

from bokeh.io import push_notebook

import pandas as pd

import numpy as np

plot_width=600

plot_height=600

x_range=(0.01,100)

y_range=(0.01,100)

scale = ‘log’

select_callback = CustomJS(code=‘’’

console.log(cb_data.geometry)

var kernel = IPython.notebook.kernel;

var x = cb_data.geometry.x

var y = cb_data.geometry.y

var xs = JSON.stringify(Array.prototype.slice.call(x))

var ys = JSON.stringify(Array.prototype.slice.call(y))

kernel.execute(‘geometry_callback(’ + xs + ', '+ ys + ‘)’, {iopub: {output: function(o){console.log(o);}}}, {silent : false});

‘’')

select = LassoSelectTool(select_every_mousemove=False, callback=select_callback)

p = figure(

plot_width=plot_width, 

plot_height=plot_height, 

x_range=x_range, 

y_range=y_range,

x_axis_type=scale,

y_axis_type=scale,

tools=['pan', 'wheel_zoom', select],

toolbar_location='above')

Vertical line

vline = Span(location=1, dimension=‘height’, line_color=‘black’,

         line_alpha=0.5, line_width=1)

Horizontal line

hline = Span(location=1, dimension=‘width’, line_color=‘black’,

         line_alpha=0.5, line_width=1)

p.xaxis[0].formatter = NumeralTickFormatter(format=‘1,.0’)

p.yaxis[0].formatter = NumeralTickFormatter(format=‘1,.0’)

p.renderers.extend([vline, hline])

selected_df = df.head(0)

def geometry_callback(x, y):

#return x

global selected_df

global xc, xy, xycrop

xc = np.array(x)

yc = np.array(y)


xycrop = np.vstack((xc,yc)).T

path = Path(xycrop, closed=True)

selected_df = df.iloc[path.contains_points(df[['x', 'y']].values)]


p.yaxis[0].formatter = NumeralTickFormatter(format='1000.000')


InteractiveImage._callbacks[ii.ref].update({

    'xmin': _x_range[0],

    'xmax': _x_range[1],

    'ymin': _y_range[0],

    'ymax': _y_range[1],

    'w': _w,

    'h': _h

})

push_notebook()

(_x_range, _y_range, _w, _h) = (None, None, None, None)

def create_image(x_range, y_range, w=plot_width, h=plot_height):

global _x_range, _y_range, _w, _h


(_x_range, _y_range, _w, _h) = (x_range, y_range, w, h)

cvs = ds.Canvas(plot_width=plot_width, plot_height=plot_height, x_range=x_range, y_range=y_range, x_axis_type=scale, y_axis_type=scale)

agg = cvs.points(df, 'x', 'y', ds.sum('count'))

img = tf.shade(agg, cmap=viridis) #, how='eq_hist')


if selected_df.shape[0]:

    selected_agg = cvs.points(selected_df, 'x', 'y', ds.sum('count'))

    selected_shade = tf.shade(selected_agg, cmap=["darkred", 'orangered'])

    img = tf.stack(img, selected_shade)


return tf.dynspread(img, 0.5)# tf.spread(img, px=3) # tf.dynspread(img, 0.25)

selected_df = df.head(0)

ii=InteractiveImage(p, create_image)

ii
⌁   Link to post
Todd_Boland
Todd_Boland

Forgot to mention: the only variable not defined but is required is the DataFrame (df). In this case, it expects a DataFrame with 3 columns: x, y and count.

···

On Thu, May 4, 2017 at 2:54 PM, ‘Todd Boland’ via Bokeh Discussion - Public bokeh@continuum.io wrote:

Hello,

I had a need to plot more datapoints than Bokeh alone could handle. I started using datashader but needed the ability to lasso data. I was able to hack together a decent solution. I am including it below for anyone that may find it useful before InteractiveImage becomes part of Bokeh proper and thus integrated with the native lasso tool. The below code should work in jupyter with datashader 0.4.0 and Bokeh 0.12.4. I included a screen shot that shows the functionality post-lasso selection.

from datashader.bokeh_ext import InteractiveImage

from datashader.utils import export_image

from bokeh.models import Span, NumeralTickFormatter

from bokeh.models import LassoSelectTool, CustomJS

from bokeh.io import push_notebook

import pandas as pd

import numpy as np

plot_width=600

plot_height=600

x_range=(0.01,100)

y_range=(0.01,100)

scale = ‘log’

select_callback = CustomJS(code=‘’’

console.log(cb_data.geometry)

var kernel = IPython.notebook.kernel;

var x = cb_data.geometry.x

var y = cb_data.geometry.y

var xs = JSON.stringify(Array.prototype.slice.call(x))

var ys = JSON.stringify(Array.prototype.slice.call(y))

kernel.execute(‘geometry_callback(’ + xs + ', '+ ys + ‘)’, {iopub: {output: function(o){console.log(o);}}}, {silent : false});

‘’')

select = LassoSelectTool(select_every_mousemove=False, callback=select_callback)

p = figure(

plot_width=plot_width, 
plot_height=plot_height, 
x_range=x_range, 
y_range=y_range,
x_axis_type=scale,
y_axis_type=scale,
tools=['pan', 'wheel_zoom', select],
toolbar_location='above')

Vertical line

vline = Span(location=1, dimension=‘height’, line_color=‘black’,

         line_alpha=0.5, line_width=1)

Horizontal line

hline = Span(location=1, dimension=‘width’, line_color=‘black’,

         line_alpha=0.5, line_width=1)

p.xaxis[0].formatter = NumeralTickFormatter(format=‘1,.0’)

p.yaxis[0].formatter = NumeralTickFormatter(format=‘1,.0’)

p.renderers.extend([vline, hline])

selected_df = df.head(0)

def geometry_callback(x, y):

#return x
global selected_df
global xc, xy, xycrop
xc = np.array(x)
yc = np.array(y)
xycrop = np.vstack((xc,yc)).T
path = Path(xycrop, closed=True)
selected_df = df.iloc[path.contains_points(df[['x', 'y']].values)]
p.yaxis[0].formatter = NumeralTickFormatter(format='1000.000')
InteractiveImage._callbacks[ii.ref].update({
    'xmin': _x_range[0],
    'xmax': _x_range[1],
    'ymin': _y_range[0],
    'ymax': _y_range[1],
    'w': _w,
    'h': _h
})
push_notebook()

(_x_range, _y_range, _w, _h) = (None, None, None, None)

def create_image(x_range, y_range, w=plot_width, h=plot_height):

global _x_range, _y_range, _w, _h
(_x_range, _y_range, _w, _h) = (x_range, y_range, w, h)
cvs = ds.Canvas(plot_width=plot_width, plot_height=plot_height, x_range=x_range, y_range=y_range, x_axis_type=scale, y_axis_type=scale)
agg = cvs.points(df, 'x', 'y', ds.sum('count'))
img = tf.shade(agg, cmap=viridis) #, how='eq_hist')
if selected_df.shape[0]:
    selected_agg = cvs.points(selected_df, 'x', 'y', ds.sum('count'))
    selected_shade = tf.shade(selected_agg, cmap=["darkred", 'orangered'])
    img = tf.stack(img, selected_shade)
return tf.dynspread(img, 0.5)# tf.spread(img, px=3) # tf.dynspread(img, 0.25)

selected_df = df.head(0)

ii=InteractiveImage(p, create_image)

ii

–

You received this message because you are subscribed to a topic in the Google Groups “Bokeh Discussion - Public” group.

To unsubscribe from this topic, visit https://groups.google.com/a/continuum.io/d/topic/bokeh/BdQV54W0WnY/unsubscribe.

To unsubscribe from this group and all its topics, send an email to bokeh+unsubscribe@continuum.io.

To post to this group, send email to bokeh@continuum.io.

To view this discussion on the web visit https://groups.google.com/a/continuum.io/d/msgid/bokeh/d687f5e8-0298-455b-a52c-c9e89fe222d6%40continuum.io.

For more options, visit https://groups.google.com/a/continuum.io/d/optout.

⌁   Link to post
Marko_Baros
Marko_Baros

Hello Todd,

I like your idea, but also I want to ask you if you know how to do it without using kernel.execute in jupyter and running it on bokeh server?

E.g. this is the code with just the generic example data frame:

from random import random

import numpy as np

import pandas as pd

from bokeh.layouts import row, column

from bokeh.models import CustomJS, ColumnDataSource, Button

from bokeh.plotting import figure, output_file, show,curdoc

output_file(“callback.html”)

x = [random() for x in range(500)]

y = [random() for y in range(500)]

df = pd.DataFrame(dict(x=x,y=y))

s1 = ColumnDataSource(df)

p1 = figure(plot_width=400, plot_height=400, tools=“lasso_select”, title=“Select Here”)

p1.circle(‘x’, ‘y’, source=s1, alpha=0.6)

s2 = ColumnDataSource(data=dict(x=, y=))

p2 = figure(plot_width=400, plot_height=400, x_range=(0, 1), y_range=(0, 1),

tools=“”, title=“Watch Here”)

p2.circle(‘x’, ‘y’, source=s2, alpha=0.6)

savebutton = Button(label=“Save”, button_type=“success”)

savebutton = Button(label=“Save”, button_type=“success”)

savebutton.callback = CustomJS(args=dict(s1=s1), code=“”"

var inds = s1.selected[‘1d’].indices;

var data = s1.data;

var out = “FSC-A;SSC-A” + “\t”;

for (i = 0; i < inds.length; i++) {

out += data[‘x’][inds[i]] + “;” + data[‘y’][inds[i]] + “\t”;

}

var res = out.slice(0, -1);

var file = new Blob([res], {type: ‘text/plain’});

var elem = window.document.createElement(‘a’);

elem.href = window.URL.createObjectURL(file);

elem.download = ‘selected-data.txt’;

document.body.appendChild(elem);

elem.click();

document.body.removeChild(elem);

“”")

s1.callback = CustomJS(args=dict(s2=s2), code=“”"

var inds = cb_obj.selected[‘1d’].indices;

var d1 = cb_obj.data;

var d2 = s2.data;

d2[‘x’] =

d2[‘y’] =

var out = “”;

for (i = 0; i < inds.length; i++) {

d2[‘x’].push(d1[‘x’][inds[i]])

d2[‘y’].push(d1[‘y’][inds[i]])

}

console.log(s2.data)

console.log(inds)

s2.change.emit();

“”")

layout = row(p1, savebutton,p2)

curdoc().add_root(layout)

curdoc().title = “Selection”

show(layout)

``

I would like to have something that will export me a pandas data frame instead of saving a plain txt file with savebutton.callback.

Thanks,
Marko

···

On Thursday, May 4, 2017 at 8:58:40 PM UTC+2, Todd Boland wrote:

Forgot to mention: the only variable not defined but is required is the DataFrame (df). In this case, it expects a DataFrame with 3 columns: x, y and count.

On Thu, May 4, 2017 at 2:54 PM, ‘Todd Boland’ via Bokeh Discussion - Public bo...@continuum.io wrote:

Hello,

I had a need to plot more datapoints than Bokeh alone could handle. I started using datashader but needed the ability to lasso data. I was able to hack together a decent solution. I am including it below for anyone that may find it useful before InteractiveImage becomes part of Bokeh proper and thus integrated with the native lasso tool. The below code should work in jupyter with datashader 0.4.0 and Bokeh 0.12.4. I included a screen shot that shows the functionality post-lasso selection.

from datashader.bokeh_ext import InteractiveImage

from datashader.utils import export_image

from bokeh.models import Span, NumeralTickFormatter

from bokeh.models import LassoSelectTool, CustomJS

from bokeh.io import push_notebook

import pandas as pd

import numpy as np

plot_width=600

plot_height=600

x_range=(0.01,100)

y_range=(0.01,100)

scale = ‘log’

select_callback = CustomJS(code=‘’’

console.log(cb_data.geometry)

var kernel = IPython.notebook.kernel;

var x = cb_data.geometry.x

var y = cb_data.geometry.y

var xs = JSON.stringify(Array.prototype.slice.call(x))

var ys = JSON.stringify(Array.prototype.slice.call(y))

kernel.execute(‘geometry_callback(’ + xs + ', '+ ys + ‘)’, {iopub: {output: function(o){console.log(o);}}}, {silent : false});

‘’')

select = LassoSelectTool(select_every_mousemove=False, callback=select_callback)

p = figure(

plot_width=plot_width, 
plot_height=plot_height, 
x_range=x_range, 
y_range=y_range,
x_axis_type=scale,
y_axis_type=scale,
tools=['pan', 'wheel_zoom', select],
toolbar_location='above')

Vertical line

vline = Span(location=1, dimension=‘height’, line_color=‘black’,

         line_alpha=0.5, line_width=1)

Horizontal line

hline = Span(location=1, dimension=‘width’, line_color=‘black’,

         line_alpha=0.5, line_width=1)

p.xaxis[0].formatter = NumeralTickFormatter(format=‘1,.0’)

p.yaxis[0].formatter = NumeralTickFormatter(format=‘1,.0’)

p.renderers.extend([vline, hline])

selected_df = df.head(0)

def geometry_callback(x, y):

#return x
global selected_df
global xc, xy, xycrop
xc = np.array(x)
yc = np.array(y)
xycrop = np.vstack((xc,yc)).T
path = Path(xycrop, closed=True)
selected_df = df.iloc[path.contains_points(df[['x', 'y']].values)]
p.yaxis[0].formatter = NumeralTickFormatter(format='1000.000')
InteractiveImage._callbacks[ii.ref].update({
    'xmin': _x_range[0],
    'xmax': _x_range[1],
    'ymin': _y_range[0],
    'ymax': _y_range[1],
    'w': _w,
    'h': _h
})
push_notebook()

(_x_range, _y_range, _w, _h) = (None, None, None, None)

def create_image(x_range, y_range, w=plot_width, h=plot_height):

global _x_range, _y_range, _w, _h
(_x_range, _y_range, _w, _h) = (x_range, y_range, w, h)
cvs = ds.Canvas(plot_width=plot_width, plot_height=plot_height, x_range=x_range, y_range=y_range, x_axis_type=scale, y_axis_type=scale)
agg = cvs.points(df, 'x', 'y', ds.sum('count'))
img = tf.shade(agg, cmap=viridis) #, how='eq_hist')
if selected_df.shape[0]:
    selected_agg = cvs.points(selected_df, 'x', 'y', ds.sum('count'))
    selected_shade = tf.shade(selected_agg, cmap=["darkred", 'orangered'])
    img = tf.stack(img, selected_shade)
return tf.dynspread(img, 0.5)# tf.spread(img, px=3) # tf.dynspread(img, 0.25)

selected_df = df.head(0)

ii=InteractiveImage(p, create_image)

ii

–

You received this message because you are subscribed to a topic in the Google Groups “Bokeh Discussion - Public” group.

To unsubscribe from this topic, visit https://groups.google.com/a/continuum.io/d/topic/bokeh/BdQV54W0WnY/unsubscribe.

To unsubscribe from this group and all its topics, send an email to bokeh+un...@continuum.io.

To post to this group, send email to bo...@continuum.io.

To view this discussion on the web visit https://groups.google.com/a/continuum.io/d/msgid/bokeh/d687f5e8-0298-455b-a52c-c9e89fe222d6%40continuum.io.

For more options, visit https://groups.google.com/a/continuum.io/d/optout.

⌁   Link to post
James_A_Bednar
James_A_Bednar

Hello,

I had a need to plot more datapoints than Bokeh alone could handle. I
started using datashader but needed the ability to lasso data. I was able
to hack together a decent solution. I am including it below for anyone that
may find it useful before InteractiveImage becomes part of Bokeh proper and
thus integrated with the native lasso tool. The below code should work in
jupyter with datashader 0.4.0 and Bokeh 0.12.4. I included a screen shot
that shows the functionality post-lasso selection.

Thanks for the code example; I'd been interested in writing something like
that as an example in Datashader, but never got around to it! But note
that there are no longer any plans to integrate InteractiveImage into Bokeh
proper, and thus no expectation that it would support the native lasso
tool, so I probably need to update some comments and docstrings. But it
would be great if HoloViews could automate this selection process, which
would eliminate the need for this custom code and would work in both
Notebook and Server contexts...

Jim

···

On Thu, May 4, 2017 at 11:54 AM, 'Todd Boland' via Bokeh Discussion - Public <bokeh@continuum.io> wrote:

from datashader.bokeh_ext import InteractiveImage
from datashader.utils import export_image
from bokeh.models import Span, NumeralTickFormatter
from bokeh.models import LassoSelectTool, CustomJS
from bokeh.io import push_notebook
import pandas as pd
import numpy as np

plot_width=600
plot_height=600
x_range=(0.01,100)
y_range=(0.01,100)
scale = 'log'

select_callback = CustomJS(code='''
console.log(cb_data.geometry)

var kernel = IPython.notebook.kernel;
var x = cb_data.geometry.x
var y = cb_data.geometry.y
var xs = JSON.stringify(Array.prototype.slice.call(x))
var ys = JSON.stringify(Array.prototype.slice.call(y))
kernel.execute('geometry_callback(' + xs + ', '+ ys + ')', {iopub:
{output: function(o){console.log(o);}}}, {silent : false});
''')
select = LassoSelectTool(select_every_mousemove=False,
callback=select_callback)

p = figure(
    plot_width=plot_width,
    plot_height=plot_height,
    x_range=x_range,
    y_range=y_range,
    x_axis_type=scale,
    y_axis_type=scale,
    tools=['pan', 'wheel_zoom', select],
    toolbar_location='above')

# Vertical line
vline = Span(location=1, dimension='height', line_color='black',
             line_alpha=0.5, line_width=1)
# Horizontal line
hline = Span(location=1, dimension='width', line_color='black',
             line_alpha=0.5, line_width=1)

p.xaxis[0].formatter = NumeralTickFormatter(format='1,.0')
p.yaxis[0].formatter = NumeralTickFormatter(format='1,.0')

p.renderers.extend([vline, hline])

selected_df = df.head(0)

def geometry_callback(x, y):
    #return x
    global selected_df
    global xc, xy, xycrop
    xc = np.array(x)
    yc = np.array(y)

    xycrop = np.vstack((xc,yc)).T
    path = Path(xycrop, closed=True)
    selected_df = df.iloc[path.contains_points(df[['x', 'y']].values)]

    p.yaxis[0].formatter = NumeralTickFormatter(format='1000.000')

    InteractiveImage._callbacks[ii.ref].update({
        'xmin': _x_range[0],
        'xmax': _x_range[1],
        'ymin': _y_range[0],
        'ymax': _y_range[1],
        'w': _w,
        'h': _h
    })
    push_notebook()

(_x_range, _y_range, _w, _h) = (None, None, None, None)
def create_image(x_range, y_range, w=plot_width, h=plot_height):
    global _x_range, _y_range, _w, _h

    (_x_range, _y_range, _w, _h) = (x_range, y_range, w, h)
    cvs = ds.Canvas(plot_width=plot_width, plot_height=plot_height,
x_range=x_range, y_range=y_range, x_axis_type=scale, y_axis_type=scale)
    agg = cvs.points(df, 'x', 'y', ds.sum('count'))
    img = tf.shade(agg, cmap=viridis) #, how='eq_hist')

    if selected_df.shape[0]:
        selected_agg = cvs.points(selected_df, 'x', 'y', ds.sum('count'))
        selected_shade = tf.shade(selected_agg, cmap=["darkred",
'orangered'])
        img = tf.stack(img, selected_shade)

    return tf.dynspread(img, 0.5)# tf.spread(img, px=3) #
tf.dynspread(img, 0.25)

selected_df = df.head(0)
ii=InteractiveImage(p, create_image)
ii

--
You received this message because you are subscribed to the Google Groups
"Bokeh Discussion - Public" group.
To unsubscribe from this group and stop receiving emails from it, send an
email to bokeh+unsubscribe@continuum.io.
To post to this group, send email to bokeh@continuum.io.
To view this discussion on the web visit https://groups.google.com/a/
continuum.io/d/msgid/bokeh/d687f5e8-0298-455b-a52c-
c9e89fe222d6%40continuum.io
<https://groups.google.com/a/continuum.io/d/msgid/bokeh/d687f5e8-0298-455b-a52c-c9e89fe222d6%40continuum.io?utm_medium=email&utm_source=footer&gt;
.
For more options, visit https://groups.google.com/a/continuum.io/d/optout\.

⌁   Link to post

End of archived discussion · Replies are disabled