Hello! I am trying to build a visual that tracks widget counts by category using hbar. The source data is not aggregated. This is what it looks like:
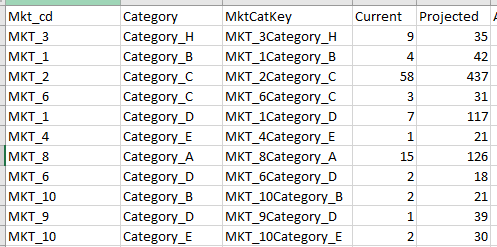
This data is aggregated at MktCatKey level, but I want to group by category and then perform a calculation on the counts. Lets say if the category is Category_A, I want to add +10 to the counts. Finally, I want to display both current and projected on a visual.
This is how far I have gotten:
query = open('workingsql.sql')
dataset = pd.read_sql_query(query.read(), cnxn)
query.close()
p = figure()

CurrentCount = dataset.Current
ProjCount = dataset.Projected
Cat = dataset.Category

grouped = dataset.groupby('Category')['Current','Projected'].sum()
source = ColumnDataSource(grouped)
p = figure(y_range=Cat)
p.hbar(y=Cat, right = CurrentCount, left = 0, height = 0.5,source=source, fill_color="#D7D7D7")
p.hbar(y=Cat, right = ProjCount, left = 0, height = 0.5,source=source, fill_color="#E21150")

hover = HoverTool()
hover.tooltips = [("Totals", "@Current Current Count")]
hover.mode = 'hline'
p.add_tools(hover)
show(p)
Apologies if this was answered before. But full disclosure, I was able to get this to work if I source directly from the dataset. But since I’m trying to perform a calculation, I cant use the source directly. I’m not fully familiar on how to do an if statement on CurrentCount to see if it’s for Category_A or not but that’s where I’m at.
I have additional things I want to do on this dataset (like bring in a goals dataset and plot against that), but taking small steps for now. Any help is appreciated.