Bokeh 1.0.1
Here are my pandas dataframe(s):
cdf.head()
Year
Month
Rating
0
2002
Jul
0.829429
1
2002
Aug
0.772742
2
2002
Sep
0.859048
3
2002
Oct
0.826250
4
2002
Nov
0.780417
acdf.head()
Month
Jan
Feb
Mar
Apr
May
Jun
Jul
Aug
Sep
Oct
Nov
Dec
Year
2002
0.000000
0.000000
0.000000
0.000000
0.000000
0.000000
0.829429
0.772742
0.859048
0.826250
0.780417
0.766739
2003
0.794586
0.788333
0.812756
0.758246
0.798598
0.800460
0.840994
0.810782
0.839610
0.821250
0.827163
0.799866
2004
0.810332
0.825000
0.812195
0.821558
0.815828
0.803860
0.817981
0.791423
0.812903
0.808825
0.813662
0.808625
2005
0.822619
0.801692
0.826941
0.810052
0.829125
0.817249
0.817197
0.829545
0.806301
0.811946
0.796417
0.831208
2006
0.818533
0.813261
0.769806
0.814383
0.819020
0.809942
0.819776
0.802465
0.801928
0.817741
0.817387
0.817363
And now my code following the EXACT same format as the heatmap example in the doc:
source = ColumnDataSource(cdf)
mapper = LinearColorMapper(palette=Inferno256, low=0.0, high=acdf.max().max())
color_bar = ColorBar(color_mapper=mapper, location=(0, 0),
ticker=BasicTicker(desired_num_ticks=256//12),
formatter=NumeralTickFormatter(format="%f"))
p = figure(plot_width=1000, plot_height=600, toolbar_location=None,
x_range=list(acdf.index), y_range=list(reversed(acdf.columns)),
tools="", x_axis_location=“above”)
p.rect(x=“Year”, y=“Month”, width=1, height=1, source=source,
line_color=None, fill_color=transform(‘Rating’, mapper))
p.add_layout(color_bar, ‘right’)
p.axis.axis_line_color = None
p.axis.major_tick_line_color = None
p.axis.major_label_standoff = 0
p.xaxis.major_label_orientation = 1.0
show(p)
``
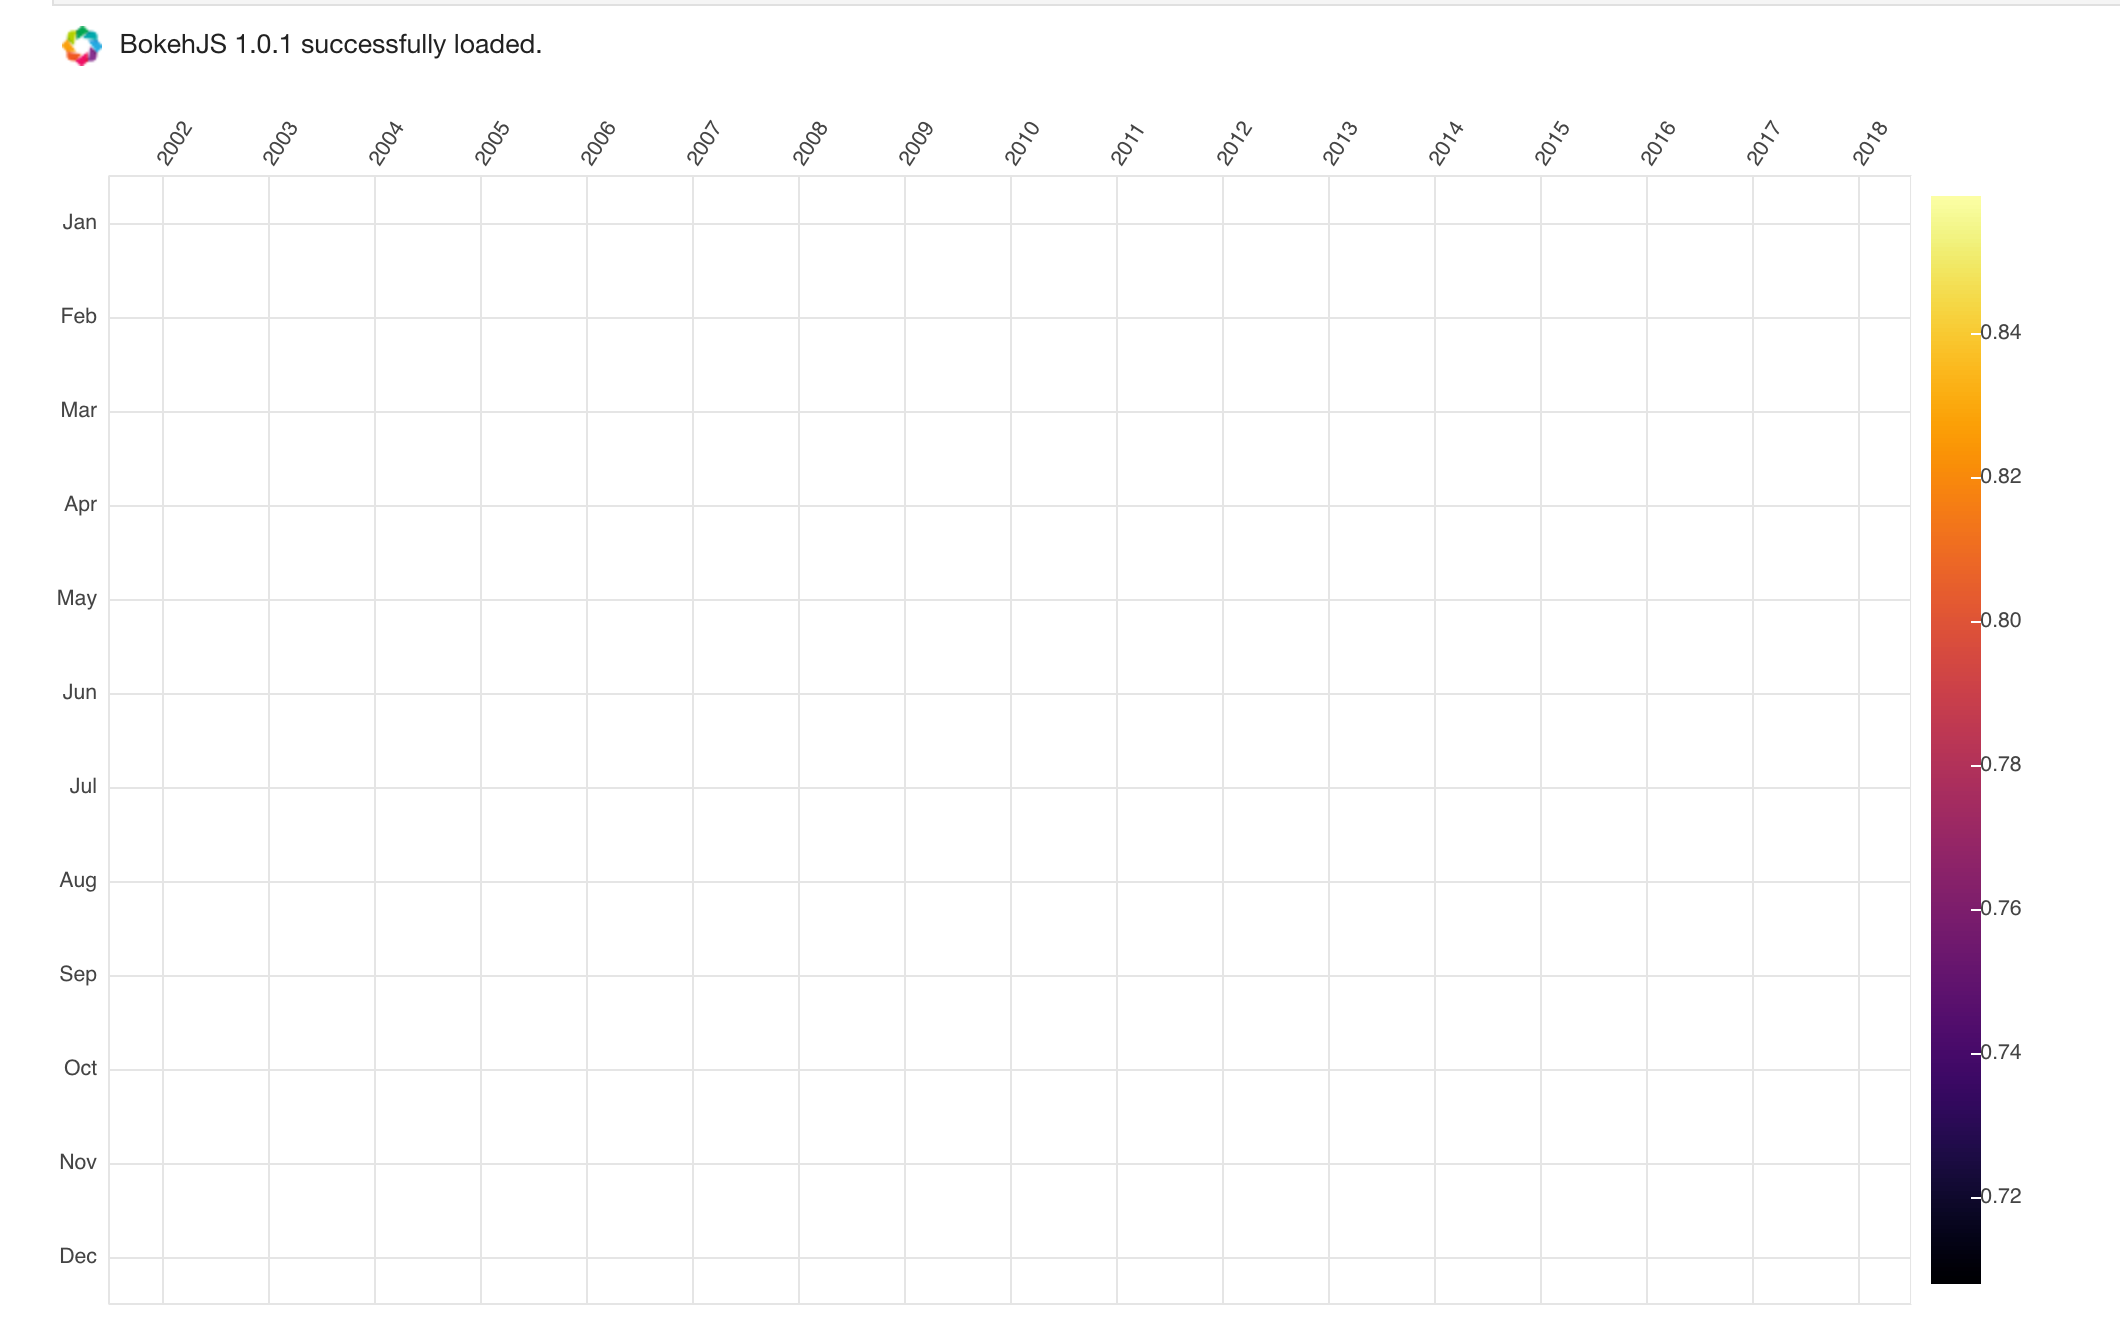
I get the rectangle with the color bar and bokeh recognizes them as percentages correctly! Great!
Only problem is the whole rectangle is blank (white) and I have not a clue why. The dataframes look fine to me.
Help!
-aps