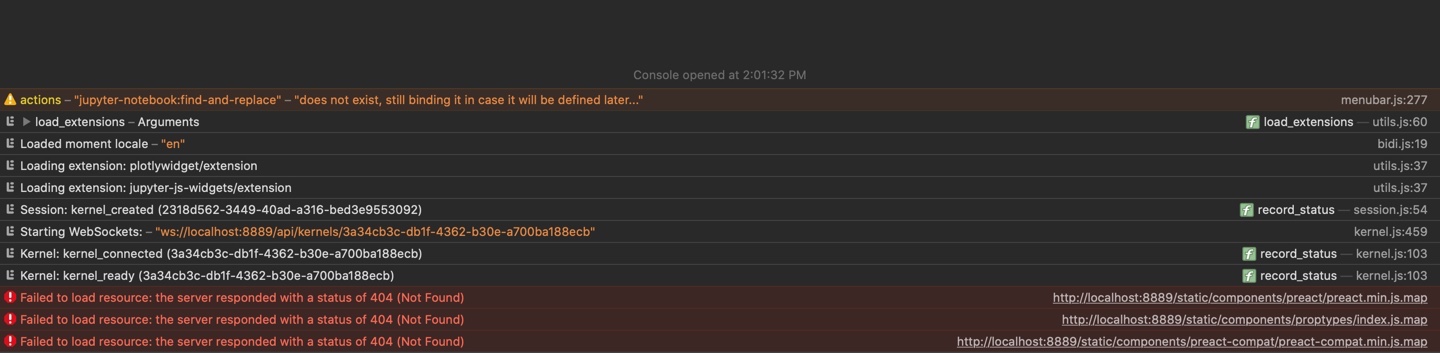
I am trying to create a Heatmap from a csv using python pandas. I keep on getting a blank screen for my output, and I not sure why-- I’ve exhausted the documentation online to try to figure it out. My code is as follows:
    import numpy as np
    from bokeh.io import output_file, show
    from bokeh.models import (
        ColumnDataSource,
        HoverTool,
        LinearColorMapper,
        BasicTicker,
        PrintfTickFormatter,
        ColorBar,
        FactorRange
    )
    from bokeh.plotting import figure
    from bokeh.sampledata.unemployment1948 import data
    from bokeh.transform import transform

    #Initialize DataFrame
    df = pd.read_csv("myData.csv")

    df.dropna().astype(float)
    df.columns.name = 'Month'
    df.index.name = 'Facility'

    df_1 = pd.DataFrame(df.stack(), columns=['state']).reset_index()
    source = ColumnDataSource(df_1)

    #Heatmap
    colors = ["#75968f", "#a5bab7", "#c9d9d3", "#e2e2e2", "#dfccce", "#ddb7b1", "#cc7878", "#933b41", "#550b1d"]
    mapper = LinearColorMapper(palette=colors, low=df_1.state.min(), high=df_1.state.max())

    TOOLS = "hover,save,pan,box_zoom,reset,wheel_zoom"

    p = figure(title="WSSDM4",
               x_range= list(df.columns), y_range=list(df.index),
               x_axis_location="above", plot_width=1800, plot_height=800,
               tools= TOOLS, toolbar_location='below',
               tooltips=[('Facility', '@Facility'), ('Month', '@Month')])

    p.rect(x='Facility', y = 'Month',width=1, height=1, source=source,
            line_color=None, fill_color=transform('state', mapper))

    color_bar = ColorBar(color_mapper=mapper, major_label_text_font_size="7px",
                         ticker=BasicTicker(desired_num_ticks=len(colors)),
                         label_standoff=6, border_line_color=None, location=(0, 0))

    p.add_layout(color_bar, 'right')

    p.axis.axis_line_color = None
    p.axis.major_tick_line_color = None
    p.axis.major_label_text_font_size = "7px"
    p.axis.major_label_standoff = 0
    p.xaxis.major_label_orientation = 1.0
    show(p)
I am using Jupyter notebooks and have all the up-to-date libraries.
Things I’ve Done to QAQC:
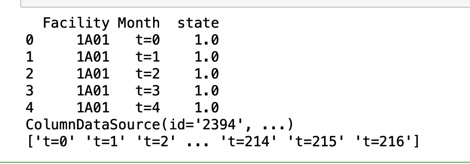
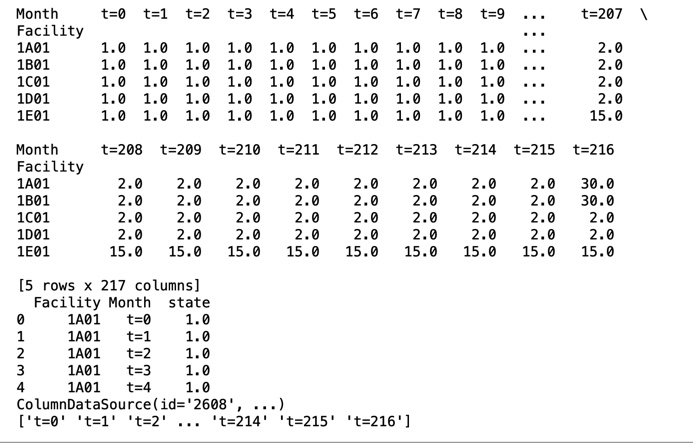
- The input I am using is formatted correctly – I tested it out by displaying df.head() after every section- it has all the correct labels (index, columns) and data types (object, float).
- When I check that the ColumnDataSource is mapped correctly, I get the outputs that I would expect (list of the state, facility, month, etc).
- Month is not a date field, but a string
Thank you!