

Hi everyone!
I am trying to make a map of a floating PV solar farm that shows performance ( or temp, current etc.) for the different groups of solar panels at a chosen date (chosen with a DateSlider).
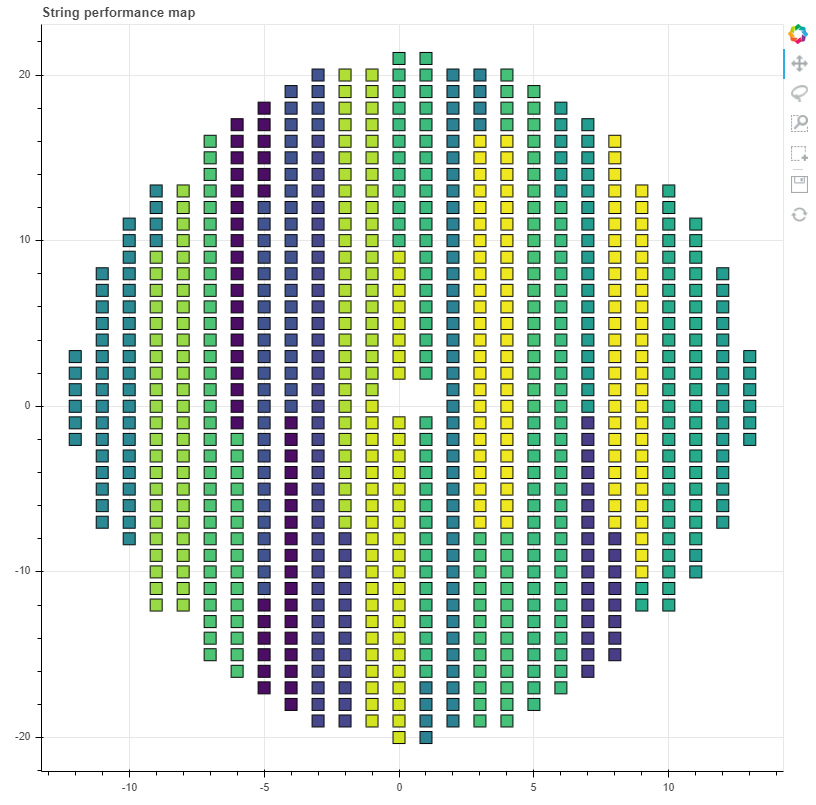
I want the map to show a clear separation between the groups (grouped as in the image). In addition the groups should be colored according how well they perform.
I have tried bokeh.charts HeatMap but it is deprecated.
What do you think is the best approach to this?
Thanks for your help!
