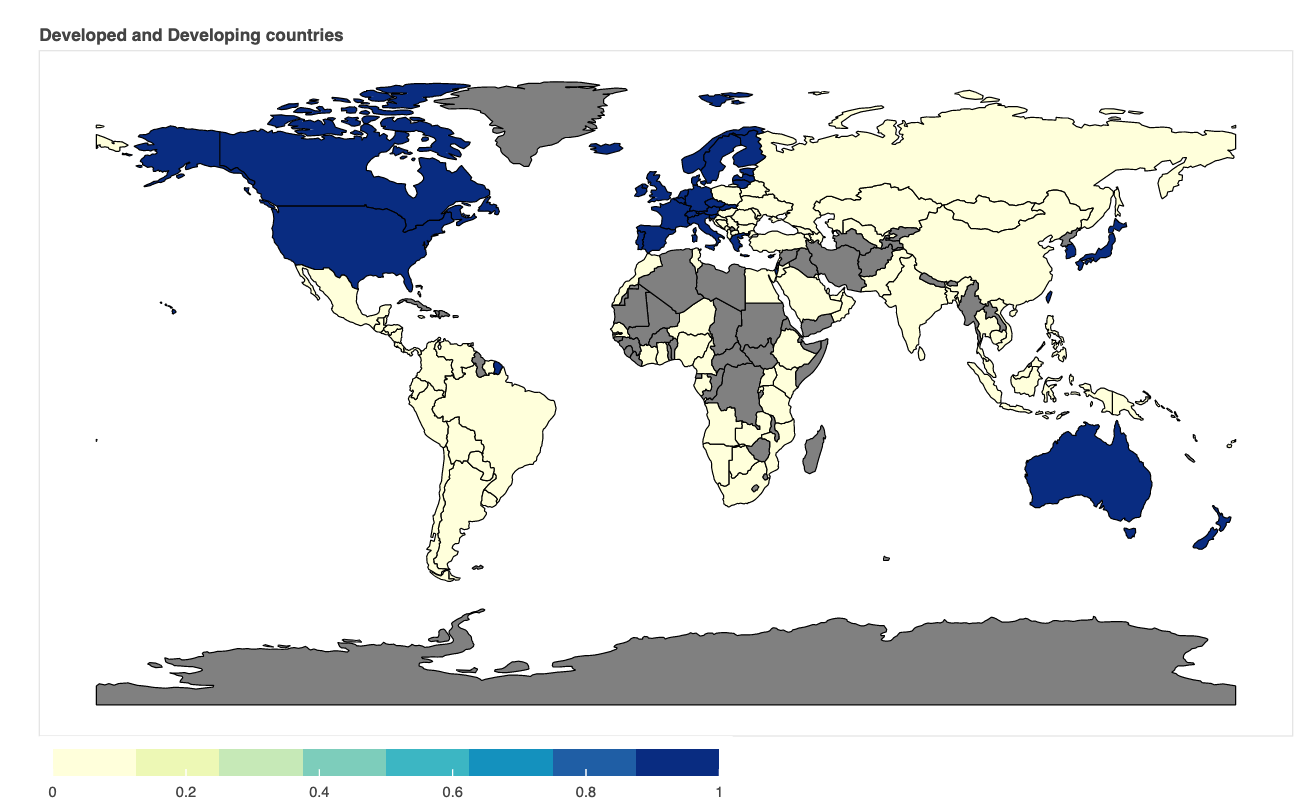
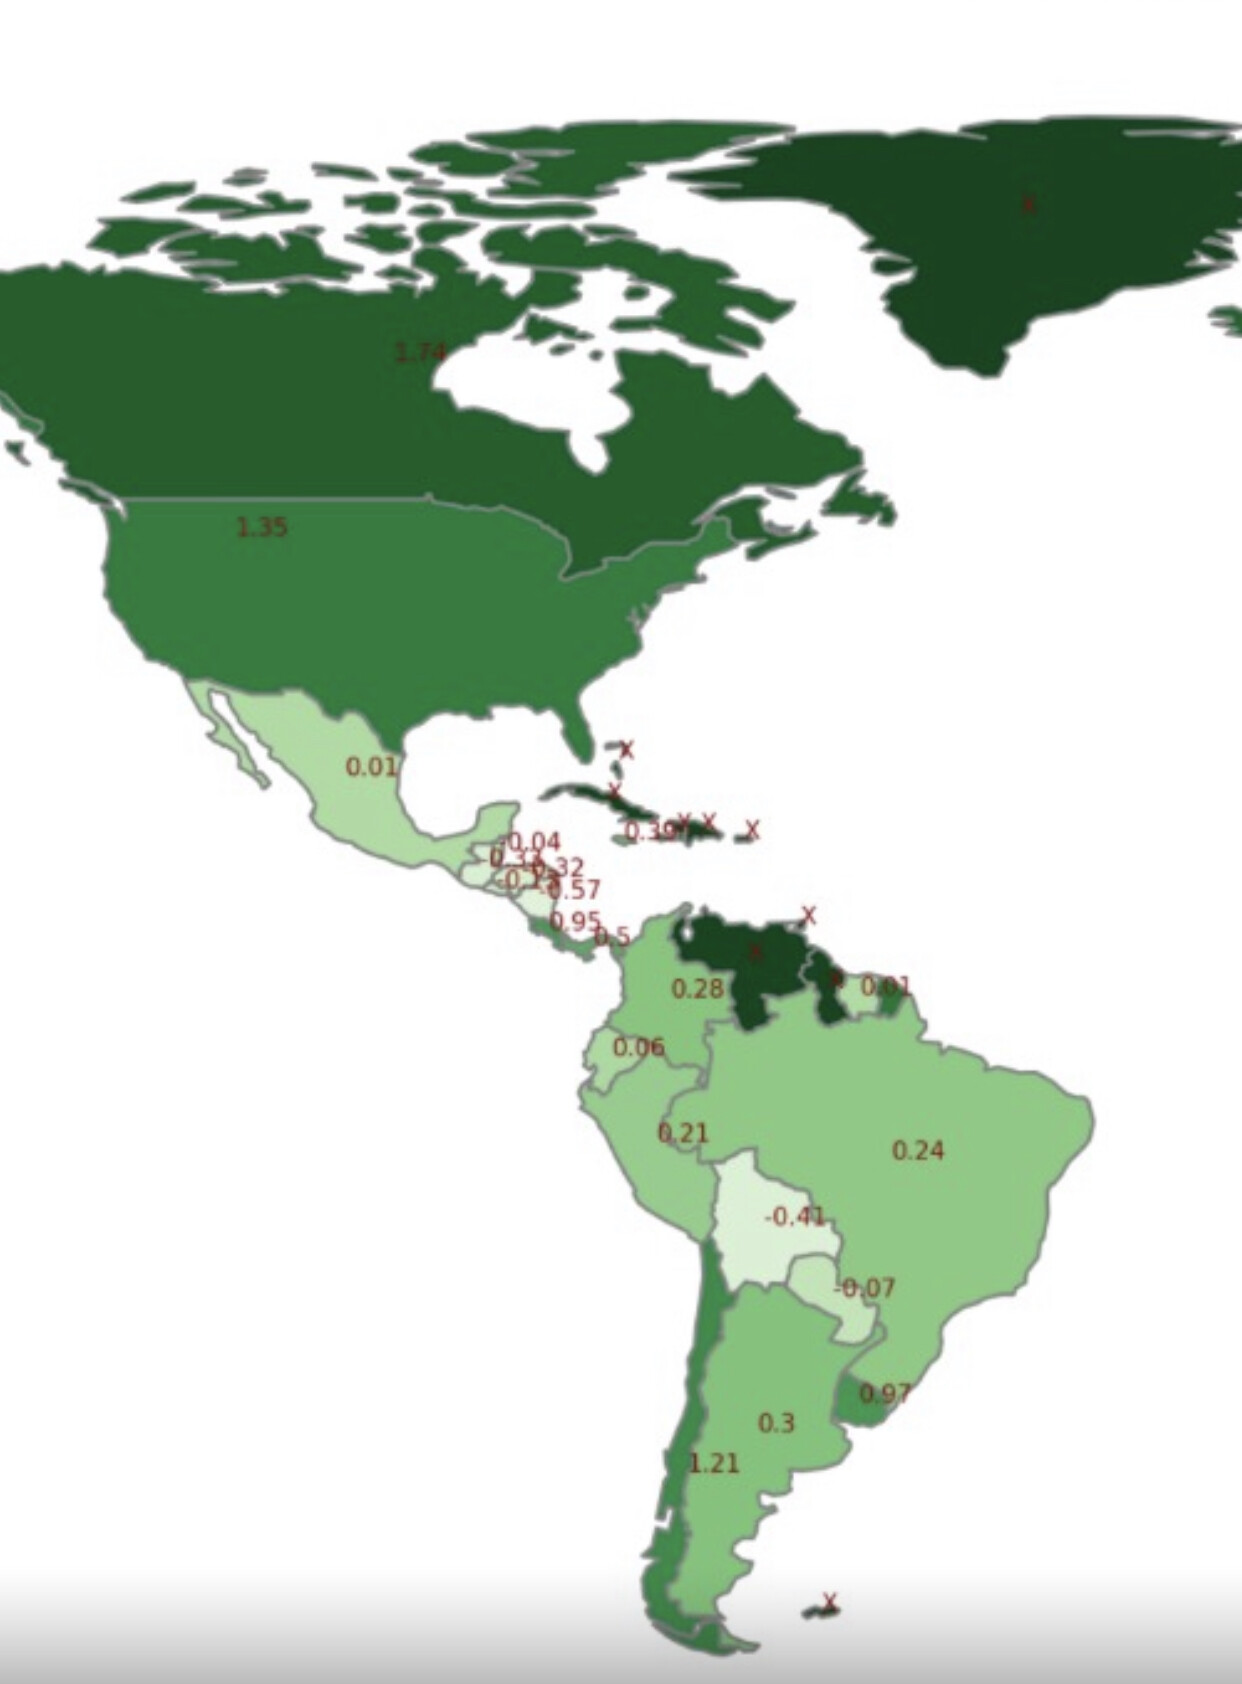
I have the following code, and the following map with the dummy variable (developed country = 1 and developing country = 0), I would like to plot this label 0 and 1 on the respective countries. How can I do it?
CODE:
from bokeh.io import output_notebook, show, output_file
from bokeh.plotting import figure
from bokeh.models import GeoJSONDataSource, LinearColorMapper, ColorBar
from bokeh.palettes import brewer
import geopandas as gpd


#Input GeoJSON source that contains features for plotting.
geosource = GeoJSONDataSource(geojson = json_data)

#Define a sequential multi-hue color palette.
palette = brewer['YlGnBu'][8]

#Reverse color order so that dark blue is highest Median_Rating.
palette = palette[::-1]

#Instantiate LinearColorMapper that linearly maps numbers in a range, into a sequence of colors.
color_mapper = LinearColorMapper(palette = palette, low = 0, high = 1)

#Define custom tick labels for color bar.
tick_labels = {'0': '0', '1': '1'}


#Create color bar.
color_bar = ColorBar(color_mapper=color_mapper, label_standoff=8,width = 500, height = 20,
border_line_color=None,location = (0,0), orientation = 'horizontal', major_label_overrides = tick_labels)


#Create figure object.
p = figure(title = 'Developed and Developing countries', plot_height = 600 , plot_width = 950, toolbar_location = None)
p.xgrid.grid_line_color = None
p.ygrid.grid_line_color = None

#Add patch renderer to figure.
p.patches('xs','ys', source = geosource,fill_color = {'field' :'IMF', 'transform' : color_mapper},
          line_color = 'black', line_width = 0.90, fill_alpha = 1)

#remove the axis
p.axis.visible = False

#Specify figure layout.
p.add_layout(color_bar, 'below')


#Display figure inline in Jupyter Notebook.
output_notebook()

#Display figure.
show(p)
PLOT (MAP)