Help on BokehJS/CustomJS to update plot from pandas dataframe?

Hi,

I am trying to create 3 dropdown menus which update a plot and a table below the plot.
User selects MatrixName, TracerContent and Temp. I need to do it for a standalone html document.
I have seen a ton of examples on how to do it, my problem is that I have a big dataframe (pandas) and when the user selects those three values it runs the locate part below (which equals data).
Not entirely sure how I can have the code get the values from a dropdown meny and have it run through the data part and replot. I assume I need to write some javascript, could someone point me in the direction or give a small hint on how to do this?

MatrixName, TracerContent, Temp = 'LAT-456', 7.5, 60.0

output_file('dashboard_sd.html')
data = mc_LTO.loc[(mc_LTO.Matrix_Name == MatrixName) & 
                  (mc_LTO.MC_Temperature == Temp) & 
                  (mc_LTO.Tracer_Content == TracerContent)]

source = ColumnDataSource(data)

LTOs = sorted(data["MC_Sample_ID"].unique())
MC_IDs = sorted(data["MC_ID"].unique())
matrixNames = sorted(data["Matrix_Names"].unique())
tracers = sorted(data["Tracer_Code"].unique())

columns = [
    TableColumn(field="MC_Sample_ID", title="LTO", editor=StringEditor(completions=LTOs), width=150),
    TableColumn(field="MC_ID", title="MC ID", editor=StringEditor(completions=MC_IDs), width=100),
    TableColumn(field="MC_Temperature", title="Temperature [°C]", editor=IntEditor()),
    TableColumn(field="Matrix_Name", title="Matrix Name", editor=SelectEditor(options=matrixNames), formatter=StringFormatter(font_style="bold"),width=450),
    TableColumn(field="Tracer_Code", title="Tracers", editor=StringEditor(completions=tracers), formatter=StringFormatter(font_style="bold"), width=150),
    TableColumn(field="Time_Input", title="Time Input", editor=IntEditor()),
    TableColumn(field="Molecular_Weight", title="Molecular Weight", editor=IntEditor()),
    TableColumn(field="Average_time_hours", title="Average time hours", editor=IntEditor()),
    TableColumn(field="A-value",        title="A-value", editor=IntEditor()),
    TableColumn(field="n-value",          title="n-value",editor=IntEditor()),
    TableColumn(field="Release [mg/(cm2*d)]", title="Release [mg/(cm2*d)]",     editor=IntEditor()),
    TableColumn(field="Coefficiant of Variance [%]", title="Coefficiant of Variance [%] ",  editor=IntEditor()),
]

data_table = DataTable(source = source, columns = columns, editable=True, width=1600))

p = plotter(data, MatrixName, TracerContent, Temp)
layout = row(column(p, data_table), column(temp_selector, tc_selector, matrix_selector, combos_selector, Spacer(width=400, height=500)))
show(layout)

To make it a truly standalone static HTML document, you will have to load the full mc_LTO data into the data source, and then use views and filters to deliver just the right data subset to the relevant plots and tables.
More details and some examples here: Providing data — Bokeh 2.4.2 Documentation

Hei,

Thanks for the help. I’m not a very good JavaScript coder but would like to learn. I tried what you mentioned and have copied the code below.
I can see the view part works, not entirely sure how to get it from the dropdown meny and update as the user selects a value.
Is it also possible to select multiple views, say I want two temperatures 50 and 60?

Thanks,
Zana

from bokeh.models import CDSView, ColumnDataSource, GroupFilter, BooleanFilter
source = ColumnDataSource(mc_LTO)

matrixName = 'RM-006'
temp = 50

booleans = [True if temp == 50 else False for temp in source.data['MC_Temperature']]
matrixView = CDSView(source=source, filters=[GroupFilter(column_name='Matrix_Name', group = matrixName)])
tempview = CDSView(source=source, filters=[BooleanFilter(booleans)])

plot_size_and_tools = {'plot_height': 600, 'plot_width': 1600,
                        'tools':['box_select', 'reset', 'help']}

p1 = figure(title="Full data set", **plot_size_and_tools)
p1.circle(x='Average_time_hours', y='Concentration', source=source, color='black')

p2 = figure(title="Matrix only", y_range=p1.y_range, **plot_size_and_tools)
p2.circle(x='Average_time_hours', y='Concentration', source=source, view=matrixView, color='red')

p3 = figure(title="Temp only", y_range=p1.y_range, **plot_size_and_tools)
p3.circle(x='Average_time_hours', y='Concentration', source=source, view=tempview, color='red')

output_file('tester.html')
show(column(p1, p2, p3))

I read a little about the CustomJSFilter. Could I do something like this (see code below).
How do I give it the arguments temp, matrixname and tracercontent?
Also I am kinda stuck on the callback from the dropdown. How do I get the values and update the plot?
Any direction or examples would be appriciated!

custom_filter = CustomJSFilter(code='''
var indices = [];

// iterate through rows of data source and see if each satisfies some constraint
for (var i = 0; i < source.get_length(); i++){
    if (source.data['MC_Temperature'][i] == temp) && (source.data['Matrix_Name'][i] == matrixName) && (source.data['Tracer_Content'][i] == TracerContent){
        indices.push(true);
    } else {
        indices.push(false);
    }
}
return indices;
''')

Yes, it’s something like that, although you don’t really need CustomJSFilter - any other filter will do just as fine. It’s just that the JS code will be different, that’s all.
CustomJSFilter and CustomJS accept args dict that can specify either Bokeh models or some Python values. More details here: JavaScript callbacks — Bokeh 2.4.2 Documentation

Take a look at my other answer here: python - Simple Date RangeSlider in Bokeh 2.0 - Stack Overflow
It links a slider instead of a dropdown, but the main principle is the same.

If you won’t be able to come up with the code yourself, post some sample data with all relevant columns and I will try to help you.

Yay, thanks so much for the link you sent. Helped alot.
I added a multiselect widget, I can get it working when the user just select one option. Is it possible to have it filter on multiple. Say if the user selects both temperature 10 and 20?
I added some dummy data and code below. If you have time to help. I used your js code but just removed the start and end part.

import pandas as pd
from bokeh.io import show
from bokeh.layouts import column
from bokeh.models import CDSView, ColumnDataSource, GroupFilter, BooleanFilter, MultiSelect
from bokeh.plotting import figure

df = pd.DataFrame({'MC_Temperature': [20, 40, 80, 10, 10, 20, 50, 50, 10, 10],
                   'Matrix_Name': ['LAT-200', 'LAT-200/LTA-202 80/20', 'LAT-220', 'LAT-200', 'LAT-200/LTA-202 80/20', 'LAT-220', 'LAT-200', 'LAT-200/LTA-202 80/20', 'LAT-220', 'LAT-220'],
                   'Tracer_Content': [10, 2, 1, 10, 2, 1, 1, 2, 1, 2], 
                   'Average_time_hours': [10, 2, 1, 8, 10, 2, 1, 8, 10, 2],
                   'Concentration': np.random.randint(low=1, high=100, size=10)})

source = ColumnDataSource(df)

plot_size_and_tools = {'plot_height': 400, 'plot_width': 400,
                        'tools':['box_select', 'reset', 'help']}
Temperature = 50

temp_filter = BooleanFilter([True if temp == Temperature else False for temp in source.data['MC_Temperature']])

selectoroptions = [str(x) for x in sorted(df.MC_Temperature.unique())]
#temp_selector = Select(title = "Temperature: ", value = "All", options = selectoroptions)
temp_multi_select = MultiSelect(title="Temperature:",
                           options=selectoroptions)

temp_multi_select.js_on_change('value', CustomJS(args=dict(f=temp_filter, source=source),
                                      code="""\
                                          const temp = cb_obj.value;
                                          f.booleans = Array.from(source.data['MC_Temperature']).map(d => (d == temp));
                                          // Needed because of https://github.com/bokeh/bokeh/issues/7273
                                          source.change.emit();
                                      """))

p = figure(title="Temp only", **plot_size_and_tools)
p.circle(x='Average_time_hours', y='Concentration', source=source, view=CDSView(source=source, filters=[temp_filter]), color='red')

output_file('tester.html')
show(column(temp_multi_select, p))

Your JS code works only because JavaScript is an inexcusable mess of a language. In JavaScript, 1 == ["1"]. If you use === instead of == in (d == temp), it will stop working.
MultiSelect.value is a list of strings. So just replace (d == temp) with temp.includes(d != null && d.toString()). The d != null check is needed just in case the data contains null.
One more thing - you start with an empty MultiSelect, but the plot already has something on it and that creates a discrepancy. Either supply value to the MutliSelect, or initialize BooleanFilter with all False values if you want the plot to correspond to the MultiSelect right after the page is loaded.

Thanks so much for the help. I am taking a Javascript code and hopefully can understand the language a little better :stuck_out_tongue:
If I have two multiselect widgets, should I define two seperate callbacks like I have done below if I would like to update the content of the other multiselect tool to only show inputs that have values/are valid. This question is maybe related more to javascript?
Again thanks for taking the time to help! Starting to understand the callback a little more now.

import pandas as pd
from bokeh.io import show
from bokeh.layouts import column
from bokeh.models import CDSView, ColumnDataSource, GroupFilter, BooleanFilter, MultiSelect
from bokeh.plotting import figure

df = pd.DataFrame({'MC_Temperature': [20, 40, 80, 10, 10, 20, 50, 50, 10, 10],
                   'Matrix_Name': ['LAT-200', 'LAT-200/LTA-202 80/20', 'LAT-220', 'LAT-200', 'LAT-200/LTA-202 80/20', 'LAT-220', 'LAT-200', 'LAT-200/LTA-202 80/20', 'LAT-220', 'LAT-220'],
                   'Tracer_Content': [10, 2, 1, 10, 2, 1, 1, 2, 1, 2], 
                   'Average_time_hours': [10, 2, 1, 8, 10, 2, 1, 8, 10, 2],
                   'Concentration': np.random.randint(low=1, high=100, size=10)})

source = ColumnDataSource(df)

plot_size_and_tools = {'plot_height': 400, 'plot_width': 400,
                        'tools':['box_select', 'reset', 'help']}
Temperature = 50
temp_filter = BooleanFilter([True if temp == Temperature else False for temp in source.data['MC_Temperature']])

tracerContent = 1
tc_filter = BooleanFilter([True if tc == tracerContent else False for tc in source.data['Tracer_Content']])

selectoroptions = [str(x) for x in sorted(df.MC_Temperature.unique())]
#temp_selector = Select(title = "Temperature: ", value = "All", options = selectoroptions)
temp_multi_select = MultiSelect(title="Temperature:",
                           options=selectoroptions)

selectoroptions = [str(x) for x in sorted(df.Tracer_Content.unique())]
#temp_selector = Select(title = "Temperature: ", value = "All", options = selectoroptions)
tc_multi_select = MultiSelect(title="Tracer Content:",
                           options=selectoroptions)

temp_multi_select.js_on_change('value', CustomJS(args=dict(f=temp_filter, source=source),
                                      code="""\
                                          const temp = cb_obj.value;
                                          f.booleans = Array.from(source.data['MC_Temperature']).map(d =>  temp.includes(d != null && d.toString()));
                                          // Needed because of https://github.com/bokeh/bokeh/issues/7273
                                          source.change.emit();
                                      """))

tc_multi_select.js_on_change('value', CustomJS(args=dict(f=tc_filter, source=source),
                                      code="""\
                                          const tc = cb_obj.value;
                                          f.booleans = Array.from(source.data['Tracer_Content']).map(d => tc.includes(d != null && d.toString()));
                                          // Needed because of https://github.com/bokeh/bokeh/issues/7273
                                          source.change.emit();
                                      """))

p = figure(title="Temp only", **plot_size_and_tools)
p.circle(x='Average_time_hours', y='Concentration', source=source, view=CDSView(source=source, filters=[temp_filter, tc_filter]), color='red')

output_file('tester.html')
show(column(temp_multi_select, tc_multi_select, p))

It could be a single callback that updates both filters. But it would be a waste of CPU cycles. There’s no downside to having two callbacks, except for maybe violating the DRY principle. And to avoid that, you can have something like def add_multiselect_filter_callback(...) to create the callback and to assign it to the relevant MultiSelect model. Of course, it would have to do some string interpolation to substitute the right column names. Or, you can pass the column name in the args. Many ways to solve it.

Ok, I will have a look into that.

Do you know why the code doesnt work on selection when I change the numbers to float numbers:

df = pd.DataFrame({'MC_Temperature': [20, 40, 80, 10, 10, 20.5, 50.5, 50, 10, 10],
                   'Matrix_Name': ['LAT-200', 'LAT-200/LTA-202 80/20', 'LAT-220', 'LAT-200', 'LAT-200/LTA-202 80/20', 'LAT-220', 'LAT-200', 'LAT-200/LTA-202 80/20', 'LAT-220', 'LAT-220'],
                   'Tracer_Content': [10.5, 2.3, 1, 10.5, 2.3, 1, 1, 2, 1, 2], 
                   'Average_time_hours': [10, 2, 1, 8, 10, 2, 1, 8, 10, 2],
                   'Release [mg/(cm2*d)]': np.random.randint(low=1, high=100, size=10)})

Notice how the first selected “Tracer Content” option says 1.0 but the actual number in the data is 1. Floats are messy, you’re better off not comparing them with ==. If you don’t really need them as floats, just convert them to strings in the data.

Yes, that helped!
I have been cont. working on the dashboard and in the previous code I did some modelling on the data. I have defined the model below. Do I need to do this in js to get the results for A and n for the selected data? Tried to find an example of it in bokeh, but can only find related to bokeh serve.
To have a standalone html, I suspect I need to add the model to each customjs below?

I had something like this previously (rest of code is below):

time = np.arange(start = 1, stop = int(round(df.Average_time_hours.max())) + 500, step = 10)
y = releasePowerFunction(time, df['A-value'].unique(), df['n-value'].unique())
p.line(time, y, color = 'black')

### rest of code: 

df = pd.DataFrame({'MC_Temperature': [20, 40, 80, 10, 10, 20.5, 50.0, 50, 10, 10],
                   'Matrix_Name': ['RM-006', 'LAT-200/LTA-202 80/20', 'LAT-220', 'LAT-200', 'LAT-200/LTA-202 80/20', 'LAT-220', 'LAT-200', 'LAT-200/LTA-202 80/20', 'LAT-220', 'LAT-220'],
                   'Tracer_Content': [10.0, 10.0, 1.0, 10.0, 2.3, 1, 1, 2, 1, 2], 
                   'Average_time_hours': [10, 2, 1, 8, 10, 2, 1, 8, 10, 2],
                   'Coefficiant of Variance [%]': [10, 2, 1, 8, 10, 2, 1, 8, 10, 2],
                   'Release [mg/(cm2*d)]': np.random.randint(low=1, high=100, size=10)})

df.MC_Temperature = df.MC_Temperature.astype(str)
df.Tracer_Content = df.Tracer_Content.astype(str)
source = ColumnDataSource(df)

powerModel = Model(releasePowerFunctionLog)
pars  = powerModel.make_params(A = 1, n = 1)

def model(df):
    df = df[df["Release [mg/(cm2*d)]"] > 0]
    R = np.log(df[['Release [mg/(cm2*d)]']].values)
    t = np.log(df[['Average_time_hours']].values)
    fits = powerModel.fit(R,  pars, method = 'leastsq', t = t)
    df['A-value'] = np.exp(fits.params['A'])
    df['n-value'] = np.float(fits.params['n'])
    return df#np.exp(fits.params['A']), np.float(fits.params['n'])

def add_multiselect_filter_callback(value, columnName):
    value_filter = BooleanFilter([True if x == value else False for x in source.data[columnName]])
    selectoroptions = [str(x) for x in sorted(np.unique(source.data[columnName]))]
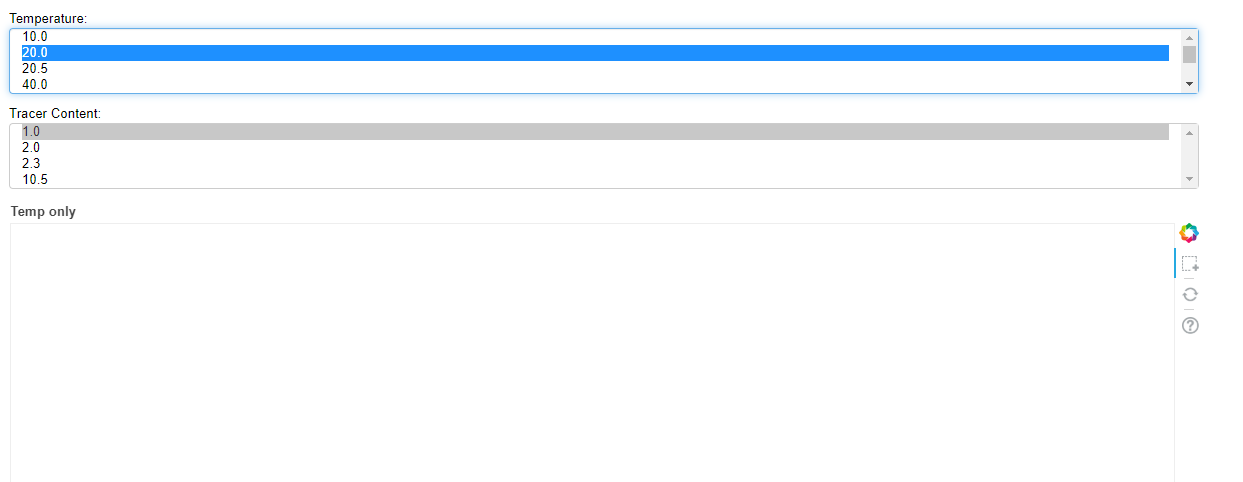
    multi_select = MultiSelect(title= columnName, value = [value],
                                    options=selectoroptions)

    return value_filter, multi_select

Temperature = '60.0'
temp_filter, temp_multi_select = add_multiselect_filter_callback(Temperature, 'MC_Temperature')
temp_multi_select.js_on_change('value', CustomJS(args = dict(f=temp_filter, source=source, columnName = 'MC_Temperature'),
                                      code="""\
                                          const val = cb_obj.value;
                                          f.booleans = Array.from(source.data[columnName]).map(d =>  val.includes(d != null && d.toString()));
                                          source.change.emit();
                                      """))
tracerContent = '10.0'
tc_filter, tc_multi_select = add_multiselect_filter_callback(tracerContent, 'Tracer_Content')
tc_multi_select.js_on_change('value', CustomJS(args = dict(f=tc_filter, source=source, columnName = 'Tracer_Content'),
                                      code="""\
                                          const val = cb_obj.value;
                                          f.booleans = Array.from(source.data[columnName]).map(d =>  val.includes(d != null && d.toString()));
                                          source.change.emit();
                                      """))
matrixName = 'RM-006'
mn_filter, mn_multi_select = add_multiselect_filter_callback(matrixName, 'Matrix_Name')
mn_multi_select.js_on_change('value', CustomJS(args = dict(f=mn_filter, source=source, columnName = 'Matrix_Name'),
                                      code="""\
                                          const val = cb_obj.value;
                                          f.booleans = Array.from(source.data[columnName]).map(d =>  val.includes(d != null && d.toString()));
                                          source.change.emit();
                                      """))
p = figure(tools = ["box_zoom", "hover", "reset", "save", "crosshair", "pan"], 
               plot_width = 1600, 
               plot_height = 600, 
               y_axis_type = "log", 
               y_axis_label = 'Release [mg/(cm2*d)]')


p2 = figure(plot_width=1600, plot_height=200, background_fill_color="#fafafa", x_range=p.x_range, 
                x_axis_label = 'Time [h]',
                y_axis_label = 'Coefficiant of Variance [%]')

p.circle(x='Average_time_hours', y='Release [mg/(cm2*d)]', source=source, view=CDSView(source=source, filters=[temp_filter, tc_filter, mn_filter]), color='black')

p2.scatter(x = "Average_time_hours", y = 'Coefficiant of Variance [%]', color = 'green', marker = 'hex', source = source, view=CDSView(source=source, filters=[temp_filter, tc_filter, mn_filter]))
p2.line(x = "Average_time_hours", y = 'Coefficiant of Variance [%]', color = 'green', line_dash = 'dashed', source = source, view=CDSView(source=source, filters=[temp_filter, tc_filter, mn_filter]))

columns = [
    TableColumn(field="MC_Sample_ID", title="LTO",  width=150),
    TableColumn(field="MC_ID", title="MC ID", width=100),
    TableColumn(field="MC_Temperature", title="Temperature [°C]", editor=IntEditor()),
    TableColumn(field="Matrix_Name", title="Matrix Name", formatter=StringFormatter(font_style="bold"),width=450),
    TableColumn(field="Tracer_Content", title="Tracer Content", formatter=StringFormatter(font_style="bold"),width=450),
    TableColumn(field="RESMAN_Tracer_Code", title="Tracers", formatter=StringFormatter(font_style="bold"), width=150),
    TableColumn(field="Time_Input", title="Time Input", editor=IntEditor()),
    TableColumn(field="Molecular_Weight", title="Molecular Weight", editor=IntEditor()),
    TableColumn(field="Average_time_hours", title="Average time hours", editor=IntEditor()),
    TableColumn(field="A-value",        title="A-value", editor=IntEditor()),
    TableColumn(field="n-value",          title="n-value",editor=IntEditor()),
    TableColumn(field="Release [mg/(cm2*d)]", title="Release [mg/(cm2*d)]",     editor=IntEditor()),
    TableColumn(field="Coefficiant of Variance [%]", title="Coefficiant of Variance [%] ",  editor=IntEditor()),
]

data_table = DataTable(source = source, columns = columns, view=CDSView(source=source, filters=[temp_filter, tc_filter, mn_filter]), width=1600)


output_file('tester.html')
layout = row(column(p, p2, data_table), column(temp_multi_select, tc_multi_select, mn_multi_select, Spacer(width=400, height=500)))
show(layout)

Should I post a new question on this maybe? I wrote something like this from what I could find online. Is this the way to do it? Should I add this to each callback function for the multiselect tool?

def releasePowerFunctionLog(t, A, n):
    return n*t + A

def releasePowerFunction(t, A, n):
    return A*np.power(t, n)


powerModel = Model(releasePowerFunctionLog)
pars  = powerModel.make_params(A = 1, n = 1)

def model(df):
    df = df[df["Release [mg/(cm2*d)]"] > 0]
    R = np.log(df[['Release [mg/(cm2*d)]']].values)
    t = np.log(df[['Average_time_hours']].values)
    fits = powerModel.fit(R,  pars, method = 'leastsq', t = t)
    df['A-value'] = np.exp(fits.params['A'])
    df['n-value'] = np.float(fits.params['n'])
    return df#np.exp(fits.params['A']), np.float(fits.params['n'])


callback = CustomJS(args=dict(source=source), code="""
    // simple linear regression
    
        var data = source.data;
        var x = Math.log(data['Average_time_hours'])
        var y = Math.log(data['Release [mg/(cm2*d)]'])
        
        for (var i = 0; i < x.length; i++) {
            sumX += x;
            sumY += y;
            sumXx += (x * x);
            sumYy += (y * y);
            sumXy += (x * y);

            data['n'] = ((x.length * sumXy) - (sumX * sumY)) / (x.length * sumXx - (sumX * sumX));
            data['A'] = (sumY - data['n'] * sumX) / x.length;
            data['rSquared'] = Math.abs((data['n'] * (sumXy - (sumX * sumY) / x.length)) / (sumYy - ((sumY * sumY) / x.length)));

            data['PowerLawFit'] = data['A']*(Math.pow(x[i], data['n']))

    source.change.emit();
    """)

Maybe I’m a bit exhausted right now, but I have no clue what’s going on in your code. What’s Model, where did it come from?

Apart from that, your code has a normal length for a question like “it doesn’t work, what did I do wrong?”. But not for a question like “is this the right way to do it?” (assuming that everything works).

In general, if you want to end up with an interactive HTML file you have to:

  • Load all relevant data into data sources
  • Avoid changing the original data sources
  • Create all necessary interactions in JavaScript, where they manipulate filters/views/expressions/transforms/any other models to avoid changing the original data

If you can formulate a succinct question with some pared down version of your code, I’ll be happy to help. Whether or not it should go into a new discussion I leave to your discretion.

I’ll have at it some more and see if I can figure it out :upside_down_face: :smile:

from lmfit import Model

That’s way beyond my pay rate. :slight_smile: But if you need to run its functions interactively, then it sounds like you cannot have just an HTML file - you have to use a Bokeh server.

Haha ok. If I go back to your previous post. If I dont alter the original data, but make a new source which is empty but uses selected data to fit a linear curve is it then possible.
I am having problems with the following example: JavaScript callbacks — Bokeh 2.4.2 Documentation

I added the code below, when I lasso select, nothing happens with the selected data.
You have an idea what I am doing wrong here:

from random import random

from bokeh.layouts import row
from bokeh.models import ColumnDataSource, CustomJS
from bokeh.plotting import figure, output_file, show

output_file("callback.html")

df = pd.DataFrame({'MC_Temperature': [20, 40, 80, 10, 10, 20.5, 50.0, 50, 10, 10],
                   'Matrix_Name': ['RM-006', 'LAT-200/LTA-202 80/20', 'LAT-220', 'LAT-200', 'LAT-200/LTA-202 80/20', 'LAT-220', 'LAT-200', 'LAT-200/LTA-202 80/20', 'LAT-220', 'LAT-220'],
                   'Tracer_Content': [10.0, 10.0, 1.0, 10.0, 2.3, 1, 1, 2, 1, 2], 
                   'Average_time_hours': [10, 2, 1, 8, 10, 2, 1, 8, 10, 2],
                   'Release [mg/(cm2*d)]': np.random.randint(low=1, high=100, size=10)})

df.MC_Temperature = df.MC_Temperature.astype(str)
df.Tracer_Content = df.Tracer_Content.astype(str)
source = ColumnDataSource(df)

sourceModel = ColumnDataSource(data=dict(x=[], y=[]))

p1 = figure(plot_width=400, plot_height=400, tools="lasso_select", title="Select Here")
p1.circle('Average_time_hours', 'Release [mg/(cm2*d)]', source=source, alpha=0.6, color = 'blue')

p2 = figure(plot_width=400, plot_height=400, x_range=p1.x_range, y_range=p1.y_range,
            tools="", title="Watch Here")

source.selected.js_on_change('indices', CustomJS(args=dict(source=source, sourceModel=sourceModel), code="""
       var inds = cb_obj.indices;
       var d1 = source.data;
       var d2 = sourceModel.data;
       d2['x'] = []
       d2['y'] = []
        for (var i = 0; i < inds.length; i++) {
            d2['x'].push(d1['Average_time_hours'][inds[i]])
            df['y'].push(d1['Release [mg/(cm2*d)]'][inds[i]])
        }
        sourceModel.change.emit();
    """)
)

p2.circle('x', 'y', source=sourceModel, alpha=0.6, color = 'red')

layout = row(p1, p2)

show(layout)

I see the error. :slight_smile: 
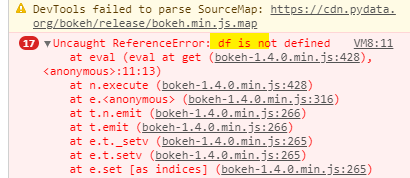
Before you fix it, open the JavaScript console in your browser and try to select something. You should see an error there.
For future reference - whenever you see something not working in Bokeh or your code that uses Bokeh, always check Python output (if applicable) and JavaScript console output (always applicable).

The error is in the line df['y'].push(d1['Release [mg/(cm2*d)]'][inds[i]]). You used df instead of d2.

Ahh!:smiley:

image

In the below part the CDSView filters the data correctly and plots only the filtered part, but the legend_group shows all names in source. Why wouldnt the legend also update to use the names that has been filtered?

p1.circle('Average_time_hours', 'Release [mg/(cm2*d)]', source=source, legend_group = 'Matrix_Name', view=CDSView(source=source, filters=[temp_filter, tc_filter, mn_filter]), alpha=0.6, color='red')