Hi, I’m trying to get the labels of a pie chart but it doesn’t work. I want to have the information color palette on the right or anything refering the data.
from math import pi
import pandas as pd
from bokeh.io import output_file, show
from bokeh.palettes import Category20c
from bokeh.plotting import figure
from bokeh.transform import cumsum
cat = data.groupby(['Category Name'])['Sales per customer'].sum().reset_index().sort_values('Sales per customer')
cat.plot.pie(
x='Category Name',
y='Sales per customer',
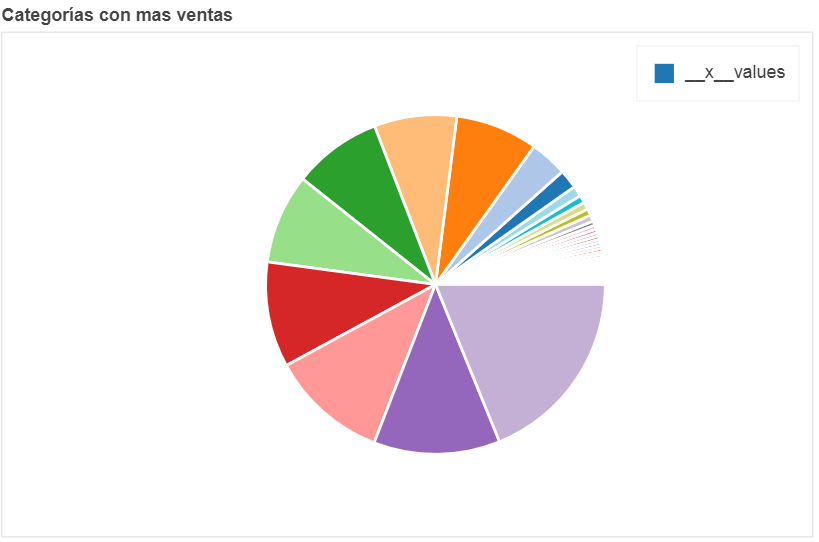
title="Categorías con mas ventas"
)
@Erick_Erazo The API you are using is not a part of Bokeh, and is not maintained by anyone on the Bokeh project. Presumably it is a part of some Pandas plotting extension, so your best bet for support or for filing a bug report is on some Pandas forum or issue tracker.
If you’d like to create a Pie chart (with legend) using plain Bokeh APIs, you can see an example here: