Hi all,
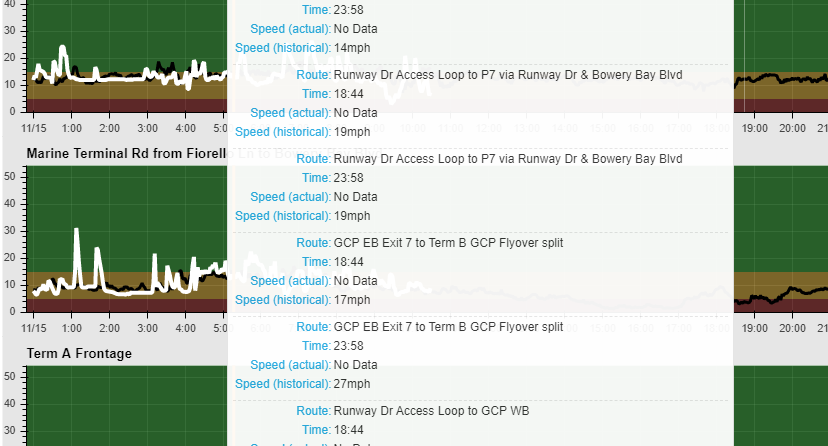
I have several plots that share a ColumnDataSource and each use a different CDSView. The problem I’m having is that when you hover over one plot, the tooltips show for every plot instead of just for the plot you’re hovering over. I’ve attached the code below that creates the plots and hovertools (normally part of a function that’s called as needed). Any help would be greatly appreciated, thanks!
TOOLS = 'hover,crosshair'

p = figure(tools=TOOLS, plot_width=plot_width, plot_height=plot_height, toolbar_location=None,
           x_axis_type='datetime', sizing_mode='scale_width', css_classes=['plot'])

# historical
g = p.line('date_time', 'speed_past', color='#000000', source=source, view=CDSView(source=source, filters=filters))

# live
p.line('date_time', 'speed', color='#ffffff', source=source, view=CDSView(source=source, filters=filters))

# HoverTool
hover = p.select(dict(type=HoverTool))
hover.renderers = [g]
hover.mode = 'vline'
hover.show_arrow = False
hover.point_policy = 'follow_mouse'
hover.tooltips = [
    ('Route', '@name'),
    ('Time', '@date_time{%H:%M}'),
    ('Speed (actual)', '@speed_str'),
    ('Speed (historical)', '@speed_past{0f}mph')
]
hover.formatters = {'date_time': 'datetime'}