

I am trying to draw a single horizontal line on fig with X axis as datetime. I have tried many components without success. The closest i can get is ray.
p.ray(x='close', y='close', line_width=1, angle=0,length=0, color='clr_drk', source=orders)
orders dataframe
    date                  close     clr_drk
2020-04-29 09:15:12.1	284.16	   blue
the figure
p = figure(x_axis_type=“datetime”, tools=TOOLS, toolbar_location=“right”,
title=sym+sym_sfx, plot_width=1000,
tooltips=[
(‘date’, ‘atdate{%F %H:%M}’),
(‘open’, ‘atopen{0}’),
(‘high’, ‘athigh{0}’),
(‘low’, ‘atow{0}’),
(‘close’, ‘atclose{0}’)
])
the main dataframe
            timestamp    open    high     low   close                date    clr_drk  clr_lgt
0 2020-04-29 15:25:00  284.15  284.15  283.95  283.95 2020-04-29 15:25:00  firebrick  #fce5bd
i am also animating everything
curdoc().add_periodic_callback(update_ohlc, 9000)
the problem is the ray is originating from the year 1970 which is not existing the data (both in the ray source and main source). as a result the main figure is pushed to the right and compressed (a day’s data is compressed as a yearly data)
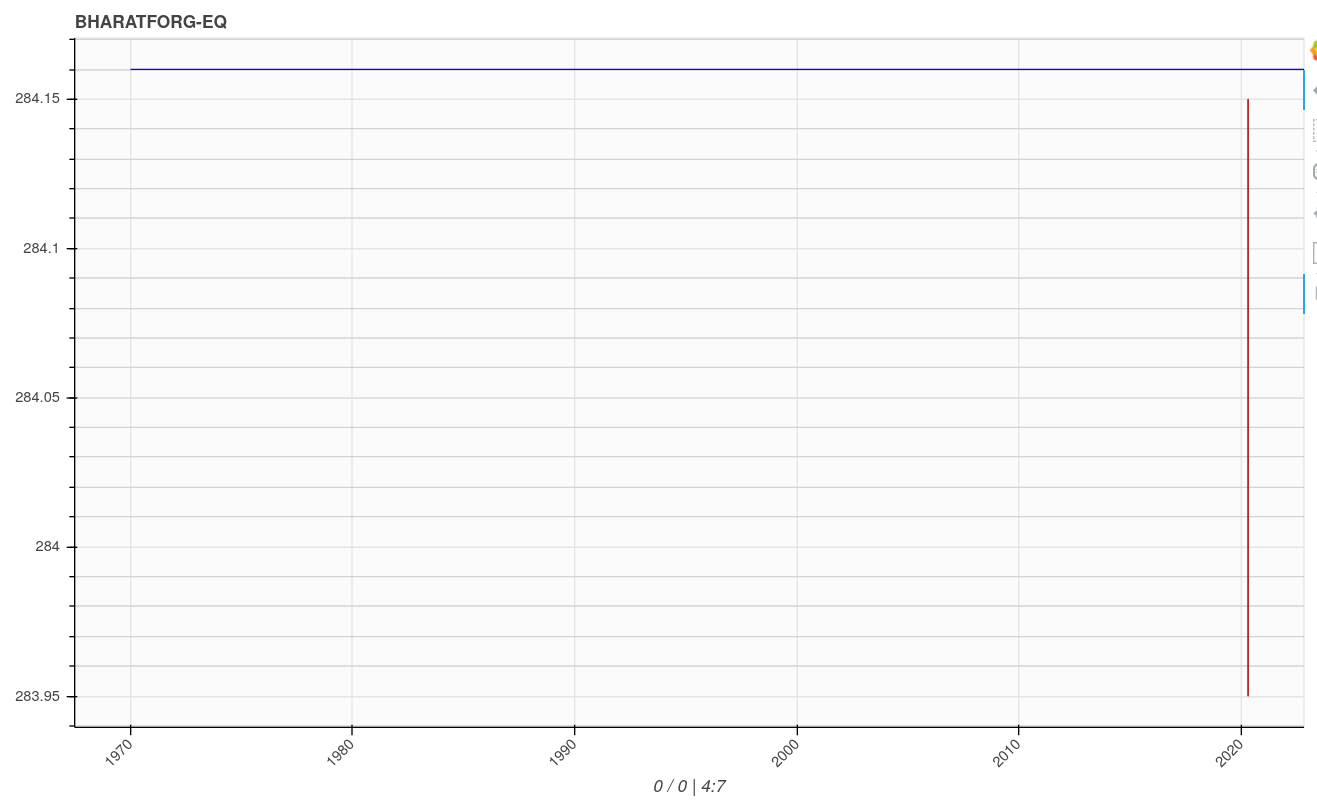
is there a way to draw a simple horizontal line without messing with the dates on X axis. kindly advise.

