

☰Read-only archive⌕
Looking for help with Bokeh?

This is a read-only archive. Ask questions and join the conversation on GitHub.

Visit Community Support on GitHub →
Archived discussions · Captured October 28, 2026

Hover more detailed than underlying gliph

Community Support
dabbatelli
dabbatelli

Hello,

I have a dataframe that looks like this:
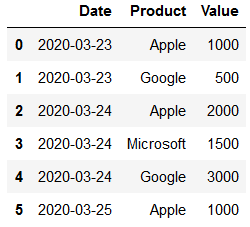
imagen

I would like to plot a simple bar chart where every bar represents the sum of the transaction for each day, basically using df.groupby(["Date"]).sum() as ColumnDataSource.

However, I would like to go one layer deeper in the the hover, showing the “details” (product and value) of each transaction, basically using df.groupby(["Date", "Product"]).sum() as source for the hover.

One workaround would be to create a “TransactionDetails” column in panda, add it to the first groupby and visualize that in the hover, but I wonder if there isn’t a better solution to have summary data in the gliph and details data in the hover?


⌁   Link to post
Bryan
Bryan

The hover tool is driven by the same data source that drives the glyph, so if you want to display something in a hover, it needs to be in the glyph data source. The only slight exception to this: it is possible to lightly abuse CustomJSHover, which is intended to perform formatting on hover values, to actual compute derived values for the tooltip.

⌁   Link to post

End of archived discussion · Replies are disabled