Bokeh version: 2.2.3
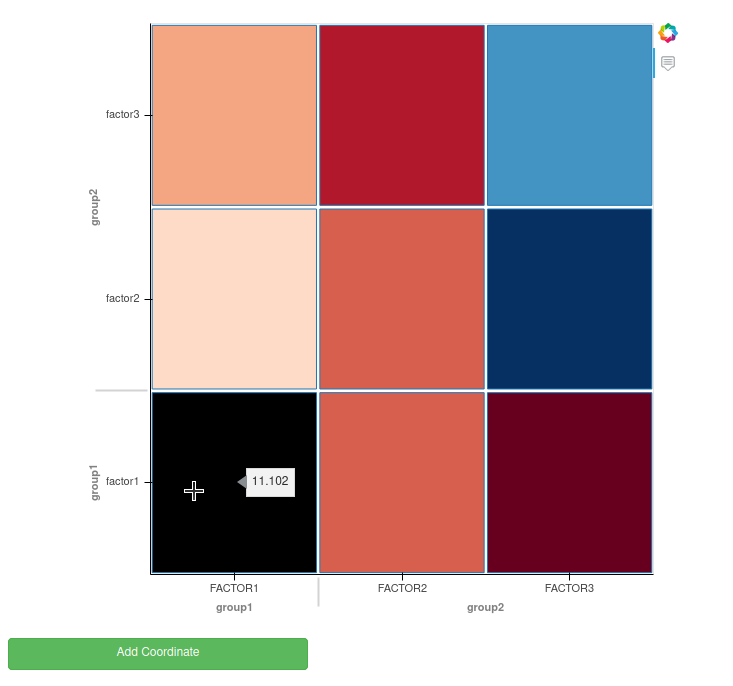
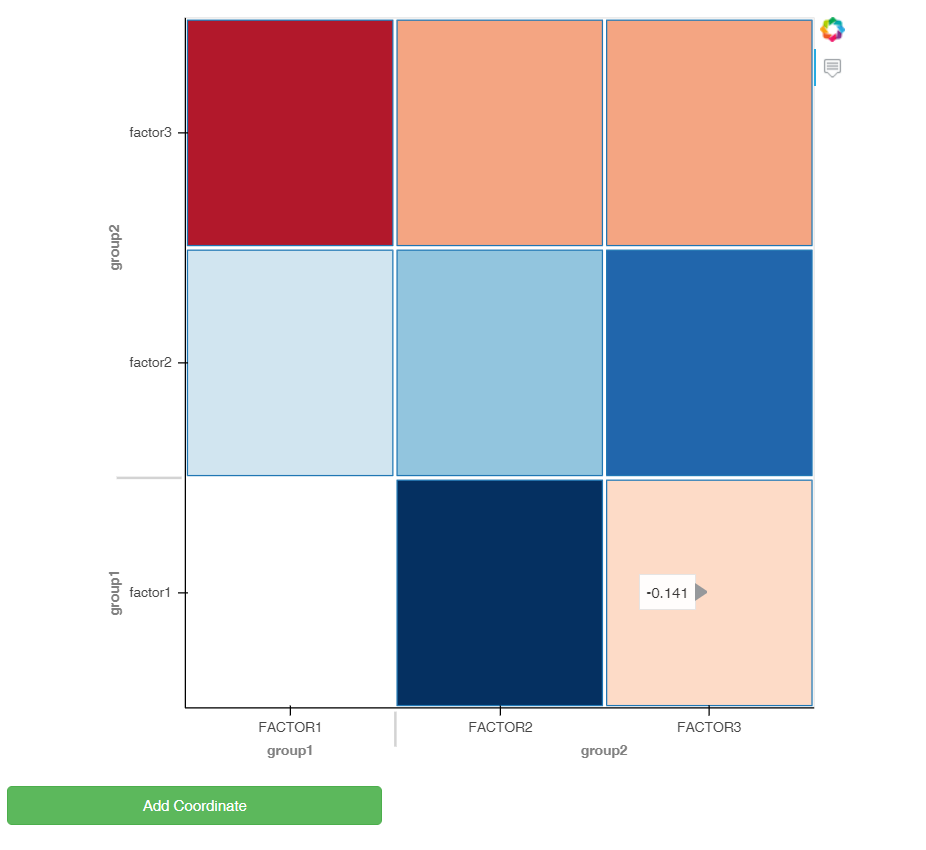
I’ve created a heatmap (with an hover tool) using a data source that misses the data of a specific coordinate (left-bottom corner):
Under the plot, I’ve added a button that adds the missing data by adding a new glyph (I didn’t add the missing data to the existing glyph’s data source).
The issue is that the hover tool isn’t displayed when hovering over the newly created glyph.
I’ve tried to set the renderers property of the hover tool to a list of the two glyph renderers but it doesn’t have any effect. It’s worth mentioning that the structure of the new data source is similar to the initial data source so the hover tool should be able to identify the columns.
This is the code:
from bokeh.models.formatters import FuncTickFormatter
from bokeh.models.mappers import LinearColorMapper
from bokeh.models.ranges import FactorRange
from bokeh.models.sources import ColumnDataSource
from bokeh.models import HoverTool, Button
from bokeh.palettes import RdBu
from bokeh.plotting import figure
from bokeh.transform import transform
from bokeh.io import curdoc
import itertools as it
import numpy as np

factors = [("group1", "factor1"), ("group2", "factor2"), ("group2", "factor3")]
factors_num = len(factors)

# create data source
data = {
    "x": list(it.chain.from_iterable(it.repeat(factor, factors_num) for factor in factors))[1:],
    "y": (factors * factors_num)[1:],
    "value": np.random.uniform(low=-1, high=1, size=8)
}
source = ColumnDataSource(data=data)

# color mapper
mapper = LinearColorMapper(palette=RdBu[11][::-1], low=-1, high=1, nan_color='lightgray')

# add a heatmap plot
plot = figure(
    x_range=FactorRange(*factors),
    y_range=FactorRange(*factors),
    tools="hover",
    tooltips="@value",
    margin=[20, 80] * 2,
)
plot.rect(
    x="x",
    y="y",
    fill_color=transform("value", mapper),
    source=source,
    width=0.98,
    height=0.98,
)

# remove grids
plot.center = []
# format tick labels
plot.below[0].formatter = FuncTickFormatter(code="return tick.toUpperCase()")
# set group padding
plot.x_range.group_padding = 0
plot.y_range.group_padding = 0

# add a button
button = Button(label="Add Coordinate", button_type="success")


# adds another glyph renderer
def callback(event):
    # remove the glyph that was added on the previous call
    if len(plot.renderers) > 1:
        plot.renderers = [plot.renderers[0]]

    factors = [("group1", "factor1")]
    data = {
        "x": factors,
        "y": factors,
        "value": np.random.uniform(low=0.5, high=13.3, size=1)
    }

    source = ColumnDataSource(data=data)
    plot.rect(
        x="x",
        y="y",
        fill_color="black",
        source=source,
        width=0.98,
        height=0.98,
    )
    plot.select_one({"type": HoverTool}).renderers = plot.renderers


# invoke callback on click
button.on_click(callback)

curdoc().add_root(plot)
curdoc().add_root(button)