Hello,
I created a sorted bar chart using the bokeh.charts interface (bokeh 0.11) folowing this example: http://bokeh.pydata.org/en/latest/docs/gallery/stacked_bar_chart.html
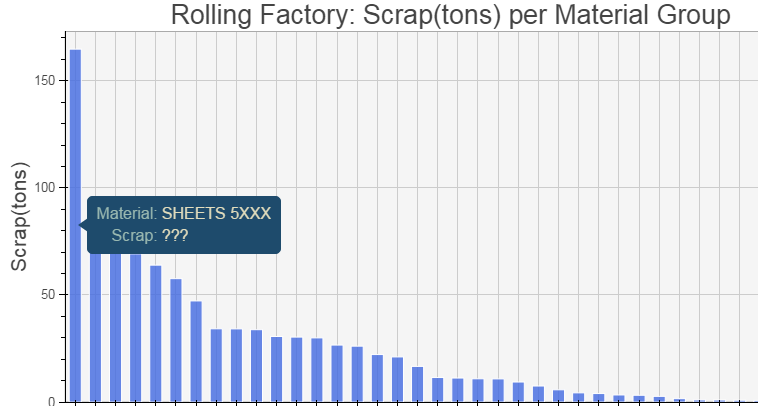
However the Hover Tool does not seem to work properly:
import pandas as pd
from bokeh.charts import Bar
from bokeh.io import output_file, show
from bokeh.charts.attributes import cat
#Creating the DataFrame for chart 1: Filtering/Grouping/Sorting
df_chart1 = df_rolling[df_rolling.SCRAP>0]
df_chart1 = df_chart1.groupby(by=‘MATERIAL_GROUP’,
*as_index=False)[‘SCRAP’].sum() *
df_chart1 = df_chart1.sort_values(by=‘SCRAP’,ascending=False)
#Calculating the Scrap in tons
df_chart1[‘SCRAP_tn’] = df_chart1.SCRAP/1000
#Plotting chart 1
chart1 = Bar(df_chart1,values=‘SCRAP_tn’,
label=cat(columns=‘MATERIAL_GROUP’,sort=False),
title=‘Rolling Factory: Scrap(tons) per Material Group’,
ylabel=‘Scrap(tons)’,xlabel=‘Material Group’,
bar_width=0.6,xgrid=True,color=‘RoyalBlue’,
tooltips=[(‘Material’,’@MATERIAL_GROUP’),(‘Scrap’,’@SCRAP_tn’)])
chart1.title_text_font_size = ‘20pt’
chart1.background_fill_color = “whitesmoke”
chart1.plot_width=900
output_file(‘DMSY.html’)
show(chart1)
The result is the attached picture. I should be able to see the amount of scrap in tons (e.g. “165.4”) but all I see is “???”
Does anyone have any idea how to help me?
Thanking you in advance for your input,
PZ