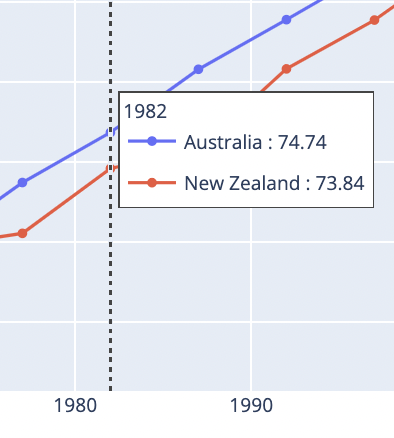
To quickly analyze the data in my charts, I need to see all the values of a multi-line chart at once.
My first idea (and preferred solution) was to display the values of the current cursor position (vline) next to the labels. Unfortunately, I can’t get this to work with JavaScript.
It’s also a challenge with the hover tool. Maybe someone can help?
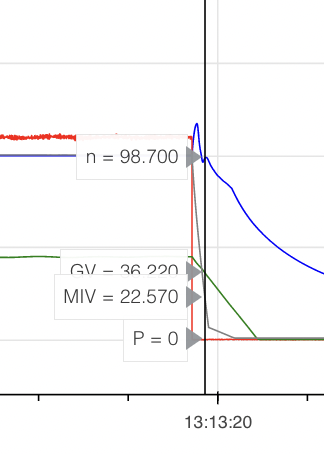
1. try: One hovertool for each line in the plot is nice, as the arrow points to the data point, but if the lines are close to each other it is useless, as they overlap.
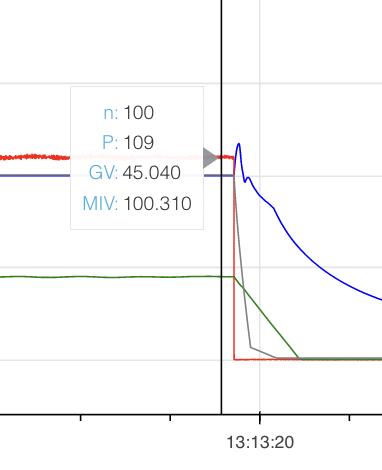
2. try: All data in one hovetool is cumbersome since I need to point exactly on a line to see the label.
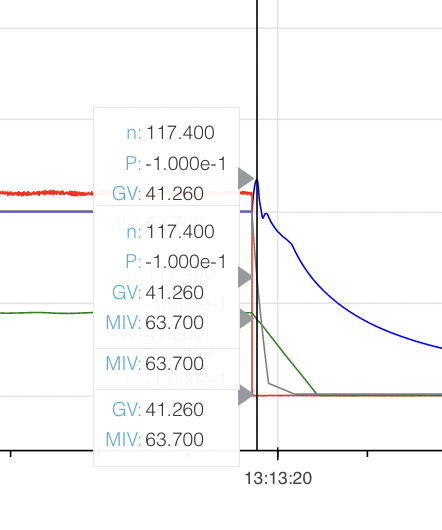
3. try: Even more overlapping.
A single label with all the information at the current x-axis position of the cursor (similar to vline mode) would be sufficient.
Is there a way to pull this off?
…
I really don’t want to switch back to plotly, but the hovertool seems to work better.
hover label for each line:
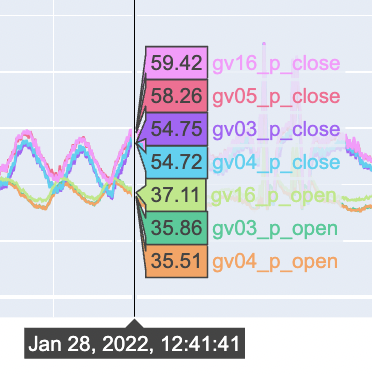
unified hover label: