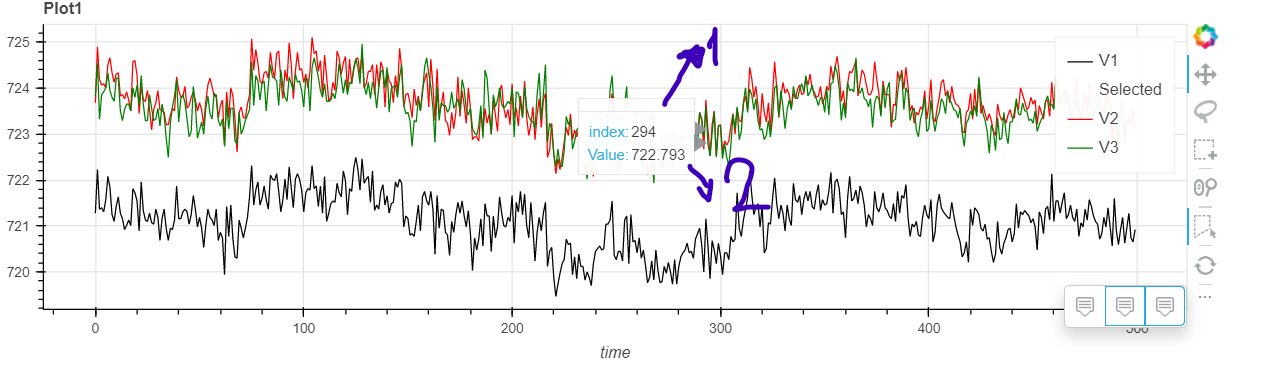
I am using HoverTool for seeing the values on the graph which contains multiple lines in the one figure but some of the line graph values are so close to each other and when I activate the Hover the values are overlaps. is there any solution to solve this problem ?