☰Read-only archive⌕
Looking for help with Bokeh?

This is a read-only archive. Ask questions and join the conversation on GitHub.

Visit Community Support on GitHub →
Archived discussions · Captured October 28, 2026

How can I do bins and Histograms in Bokeh?

Community Support
mbilyanov
mbilyanov

Hi,

I’m back to using Bokeh from another plotting platform and I’m completely lost. I have a very simple example that should bin plotting bins as histograms, but I can’t seem to be able to get the bokeh API to work.

import pandas as pd
import numpy as np

def construct_labels(start, end):
    labels = []
    for index, x in enumerate(start):
        y = end[index]
        labels.append('({}, {}]'.format(x, y))
    return labels


values = {'Length': np.random.uniform(0, 4, 10)}
df = pd.DataFrame(values, columns=['Length'])

bin_step_size = 0.5

# List of bin points.
p_bins = np.arange(0, (df['Length'].max() + bin_step_size), bin_step_size)

# Reduce the tail to create the left side bounds.
p_left_limits = p_bins[:-1].copy()

# Cut the head to create the right side bounds.
p_right_limits = np.delete(p_bins, 0)

# Create the bins.
p_range_bins = pd.IntervalIndex.from_arrays(p_left_limits, p_right_limits)

# Create labels.
p_range_labels = construct_labels(p_left_limits, p_right_limits)

p_ranges_binned = pd.cut(
    df['Length'],
    p_range_bins,
    labels=p_range_labels,
    precision=0,
    include_lowest=True)

counts = p_ranges_binned.value_counts(sort=False)

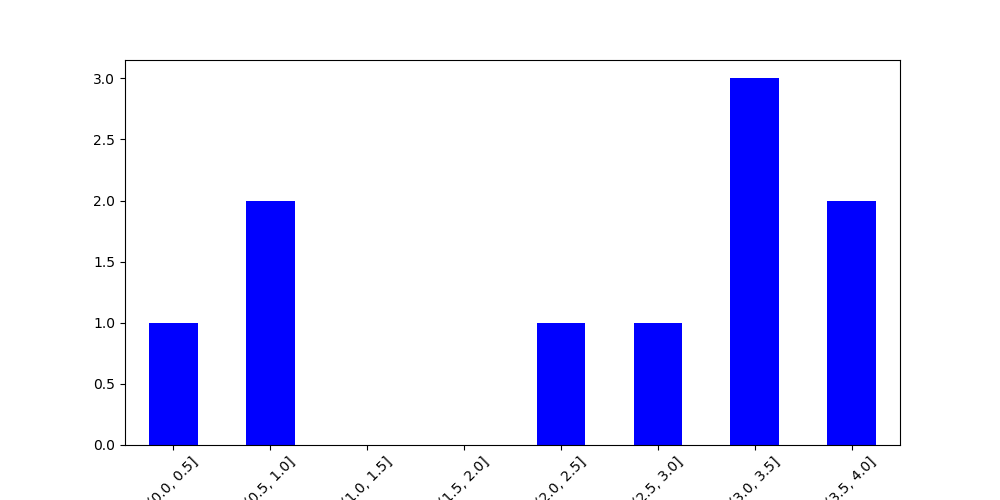
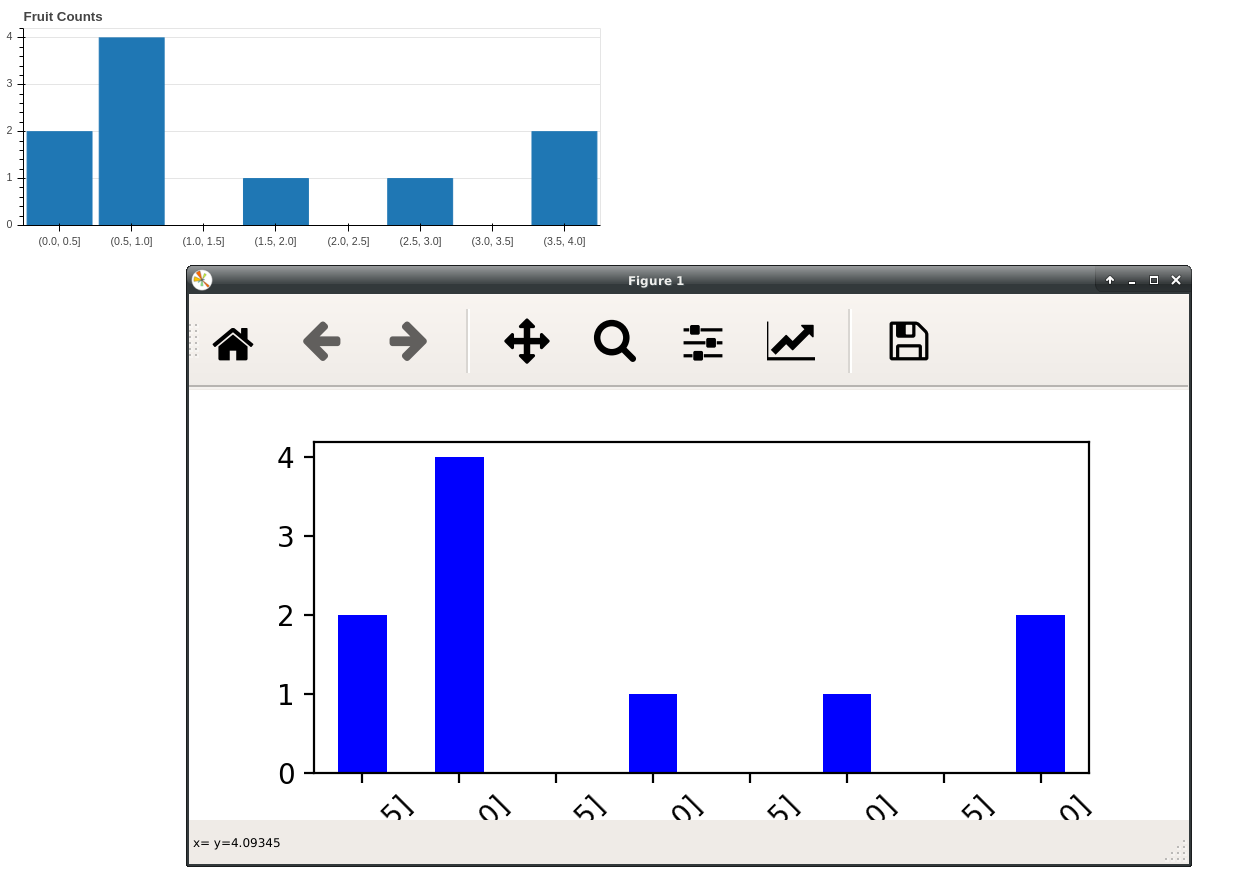
… and from here I’m pretty much lost. I can plot the above in matplotlib now, and it looks like this. But I just can’t figure out what was the Bokeh way :frowning:

⌁   Link to post
mbilyanov
mbilyanov

Got it, thank you!

output_file("bars.html")
out = p_ranges_binned
counts = out.value_counts(sort=False)

bin_labels = p_range_labels

p = figure(x_range=bin_labels, plot_height=250, title="Range Counts",
           toolbar_location=None, tools="")

p.vbar(x=bin_labels, top=counts, width=0.9)

p.xgrid.grid_line_color = None
p.y_range.start = 0

show(p)
⌁   Link to post
Bryan
Bryan

If you actually want histogram (which has a continuous axis) is there a reason you are implementing it with bar chart (which has a categorical axis)? That is bound to make things more complicated than necessary.

This is how I would normally draw a histogram:

hist, edges = np.histogram(data, density=True)

p = figure()
p.quad(top=hist, left=edges[:-1], right=edges[1:], line_color="white")

Edit: updated to use quad

⌁   Link to post
Bryan
Bryan

Just to be clear, the fundamental difference is not how the bin are built (e.g. np.histrogram or somethign else, it doesn’t matter). But whether you pass a list of string (categorical) labels as the range, instead of just using the bar edge coordinates.

⌁   Link to post
mbilyanov
mbilyanov

Cool, seems to be working. Thank you.

Ideally, I will need to have percentages on the left (y-scale), is there a built in way, or should I rework that myself? I would like to show, like %5 instead of the count. Indicating that %5 of the values are in bin (0.5, 1.5]

⌁   Link to post
Bryan
Bryan

There are lots of options for formatting tick labels:

I’d suggest giving things a try and asking a (new, separate) question if you get stuck

⌁   Link to post
mbilyanov
mbilyanov

Sure, thank you. Could you please help me to find the documentation for the quad() method, is it this one?

⌁   Link to post
Bryan
Bryan

Yes, also described in the users guide

⌁   Link to post

End of archived discussion · Replies are disabled