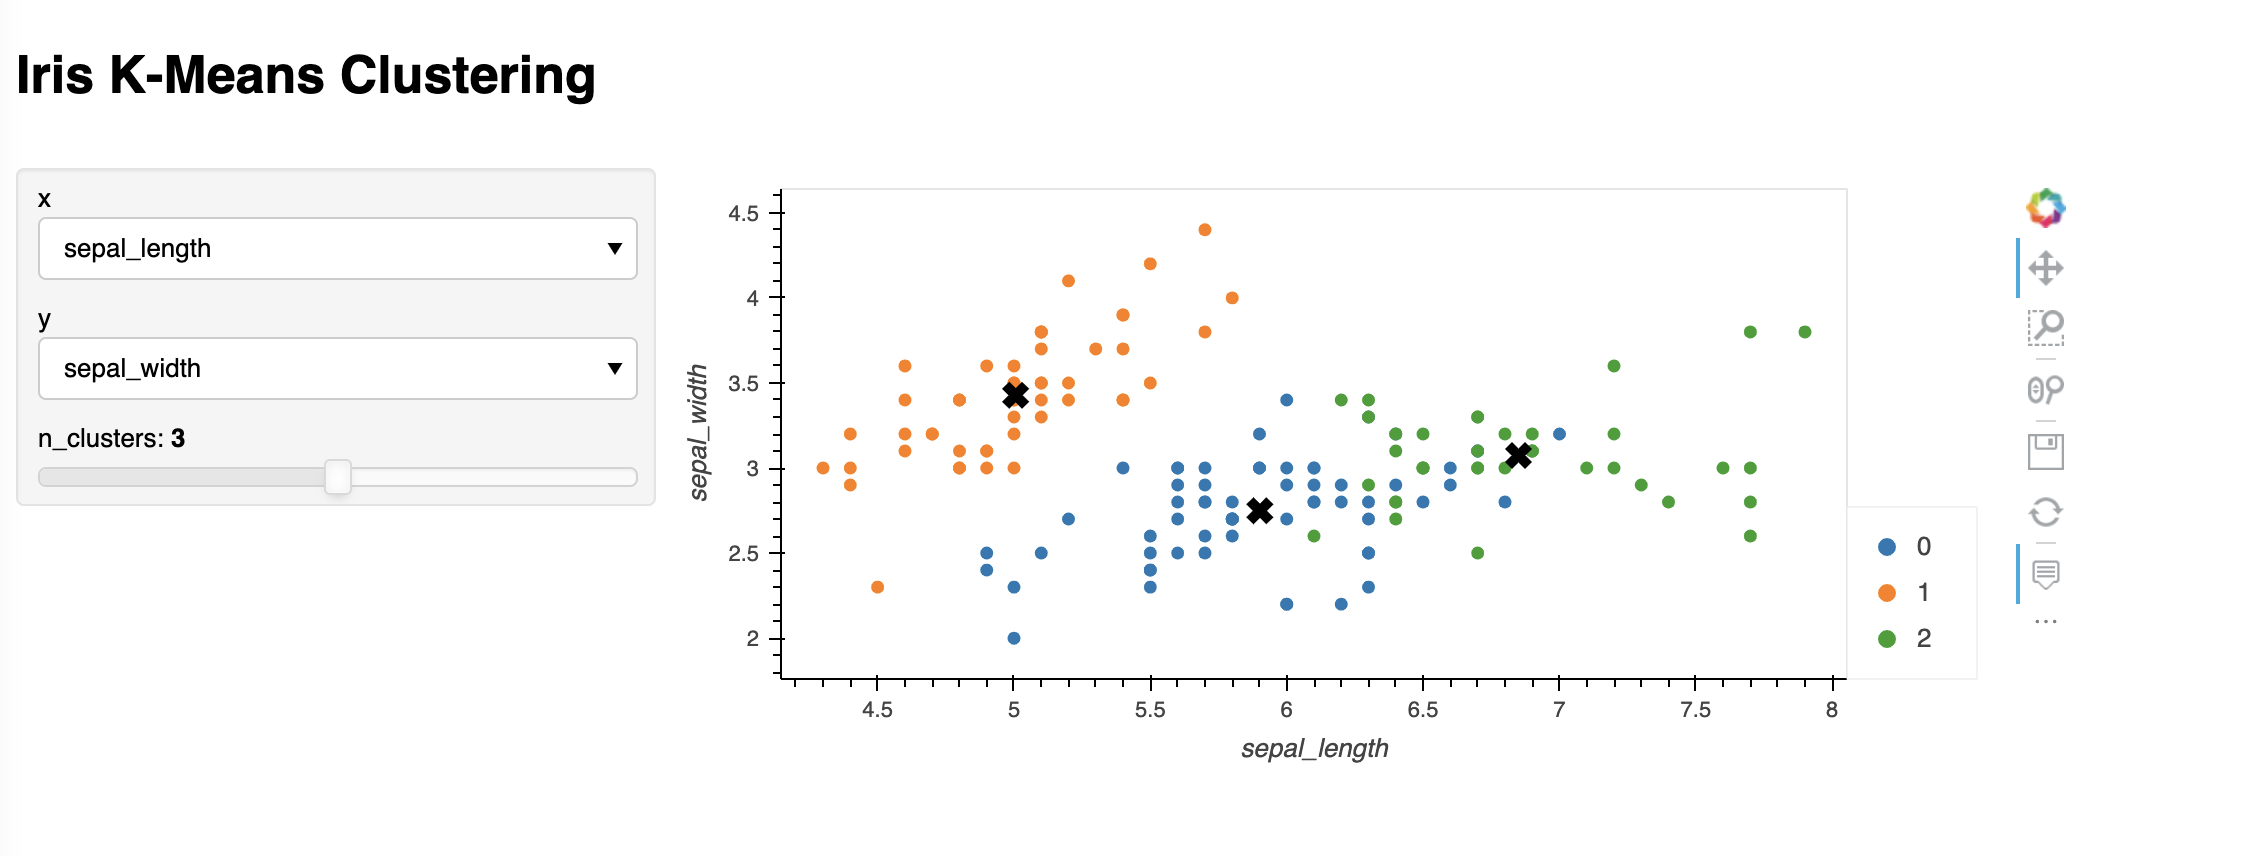
If you log in to your Heroku dashboard, click on the app of interest (in case you have more than one), it should take you to a new view that includes all the top-level info for that application.
Along the righthand side, there should be a column labeled Latest Activity. This shows updates related to builds succeeding or failing, builds deploying, etc. Do you see anything there? If yes, does it all make sense and do you see that your application has been successfully built and deployed?
As a next step, there is a banner along the top of that same view for the selected app. At the far-right, there is a More widget, where you can see additional information. Select “View Logs”. This will pull up logs from the app server and show you any problems with it running, any connection attempts, and successful connections, etc.
Is that where you looked and reported “no errors”? Does the server not show any lines like the following, which I excerpted from my test case to deploy the iris example we’re discussing above. The connection messages on the server happen when a client uses their web browser to go to the site.
2022-05-06T21:34:34.481363+00:00 app[web.1]: 2022-05-06 21:34:34,481 WebSocket connection opened

2022-05-06T21:34:34.481786+00:00 app[web.1]: 2022-05-06 21:34:34,481 ServerConnection created

2022-05-06T21:53:57.030969+00:00 heroku[router]: at=info method=GET path="/iris_kmeans/ws" host=########.herokuapp.com request_id=6b64d763-5766-4b89-a830-bc05ca2b6e0d fwd="96.84.232.113" dyno=web.1 connect=0ms service=1162547ms status=101 bytes=18435 protocol=https

2022-05-06T21:53:57.028310+00:00 app[web.1]: 2022-05-06 21:53:57,028 WebSocket connection closed: code=1001, reason=None